Fig. 4
Download original image
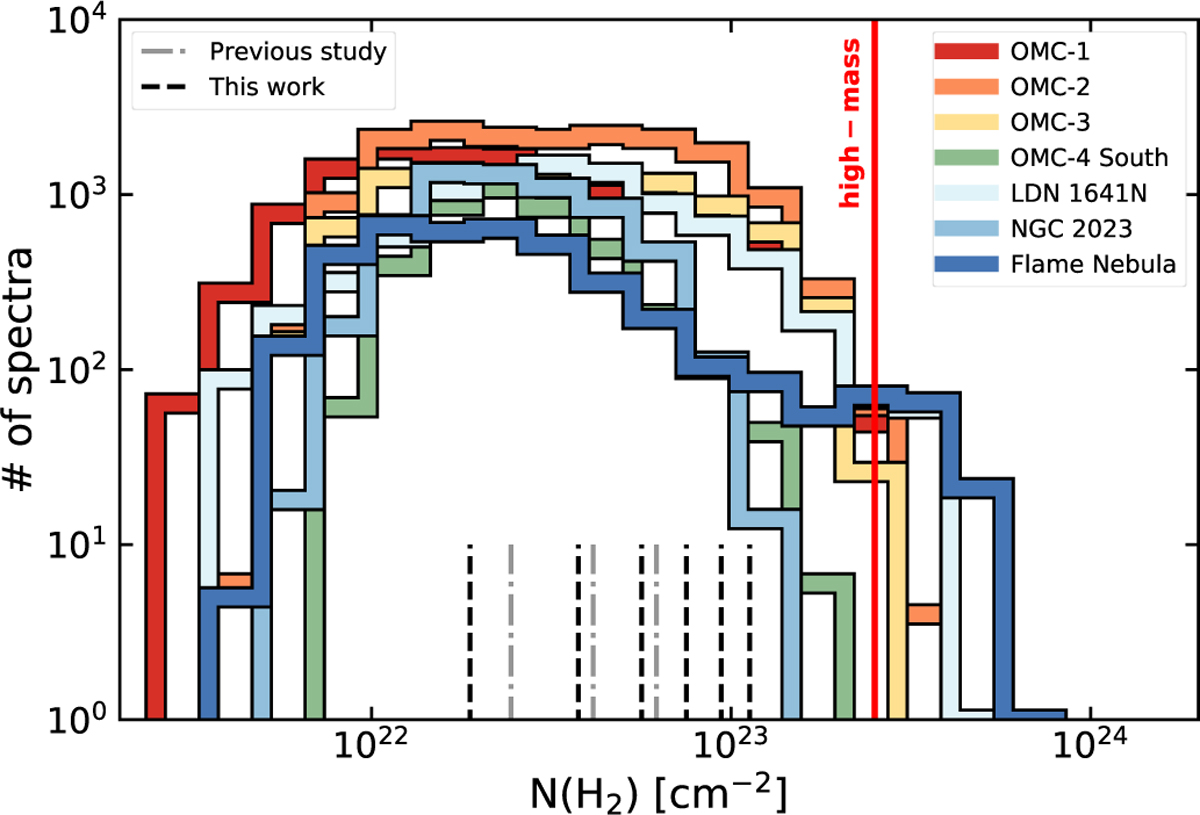
Histogram of the total column density N(H2) detected in N2H+ in the different fields explored by the EMERGE Early ALMA Survey (see colours in legend). Three dashed grey lines (at [26, 44, 66] AV) indicate the column density thresholds used by Hacar et al. (2018) during the analysis of the OMC-1 and OMC-2 regions. The additional six solid black lines (at [20, 40, 60, 80, 100, 120] AV) indicate the new HiFIVe thresholds used in this work in order to cover the wide dynamic range of column densities in our entire sample. The solid red line shows instead the theoretical prediction for high-mass star-formation (Krumholz & McKee 2008).
Current usage metrics show cumulative count of Article Views (full-text article views including HTML views, PDF and ePub downloads, according to the available data) and Abstracts Views on Vision4Press platform.
Data correspond to usage on the plateform after 2015. The current usage metrics is available 48-96 hours after online publication and is updated daily on week days.
Initial download of the metrics may take a while.