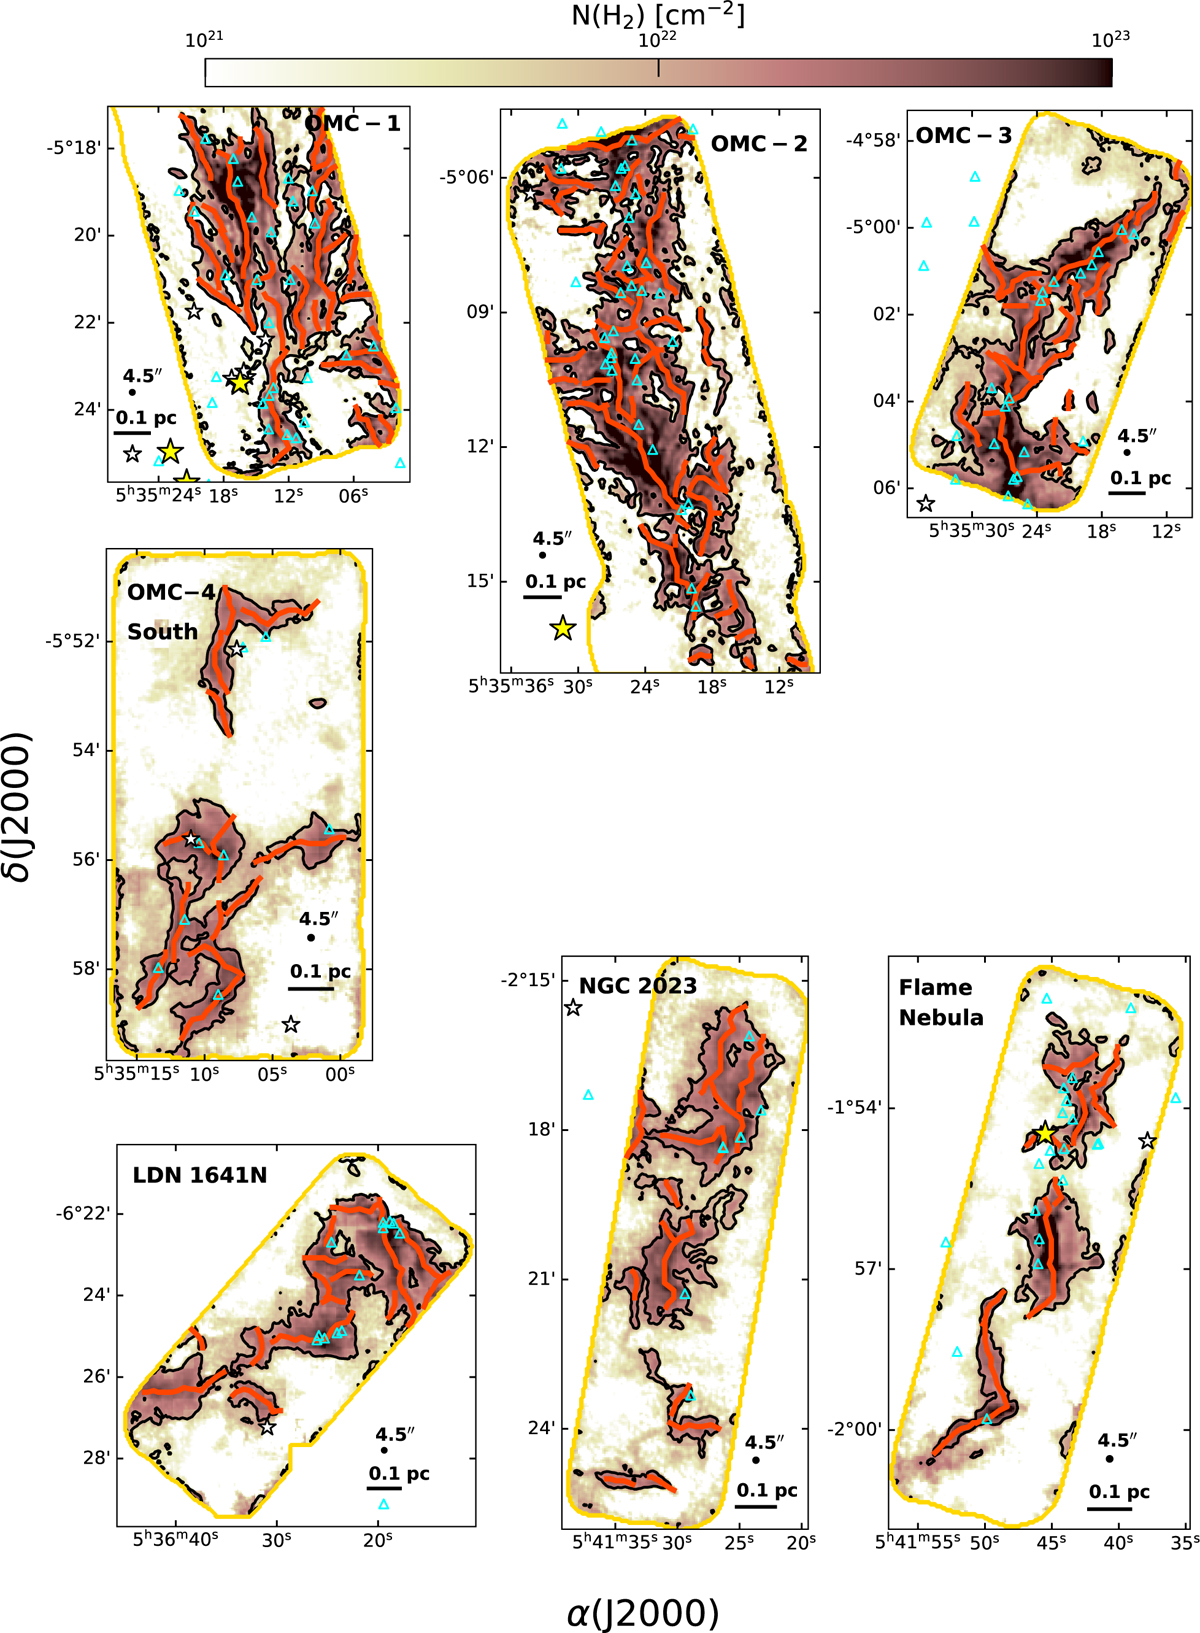
Fig. 3
Download original image
Total column density maps of the regions derived from the temperature corrected N2H+ (1−0) integrated intensity (see Eq. (1)). The black contour corresponds again to an intensity of N2H+ three times the noise. The red lines represent instead the axes of the fibers identified in our kinematic analysis (see Sect. 4). Same as in Fig. 1, the cyan triangles are the protostellar objects while the yellow and white stars are respectively the O-B stars.
Current usage metrics show cumulative count of Article Views (full-text article views including HTML views, PDF and ePub downloads, according to the available data) and Abstracts Views on Vision4Press platform.
Data correspond to usage on the plateform after 2015. The current usage metrics is available 48-96 hours after online publication and is updated daily on week days.
Initial download of the metrics may take a while.