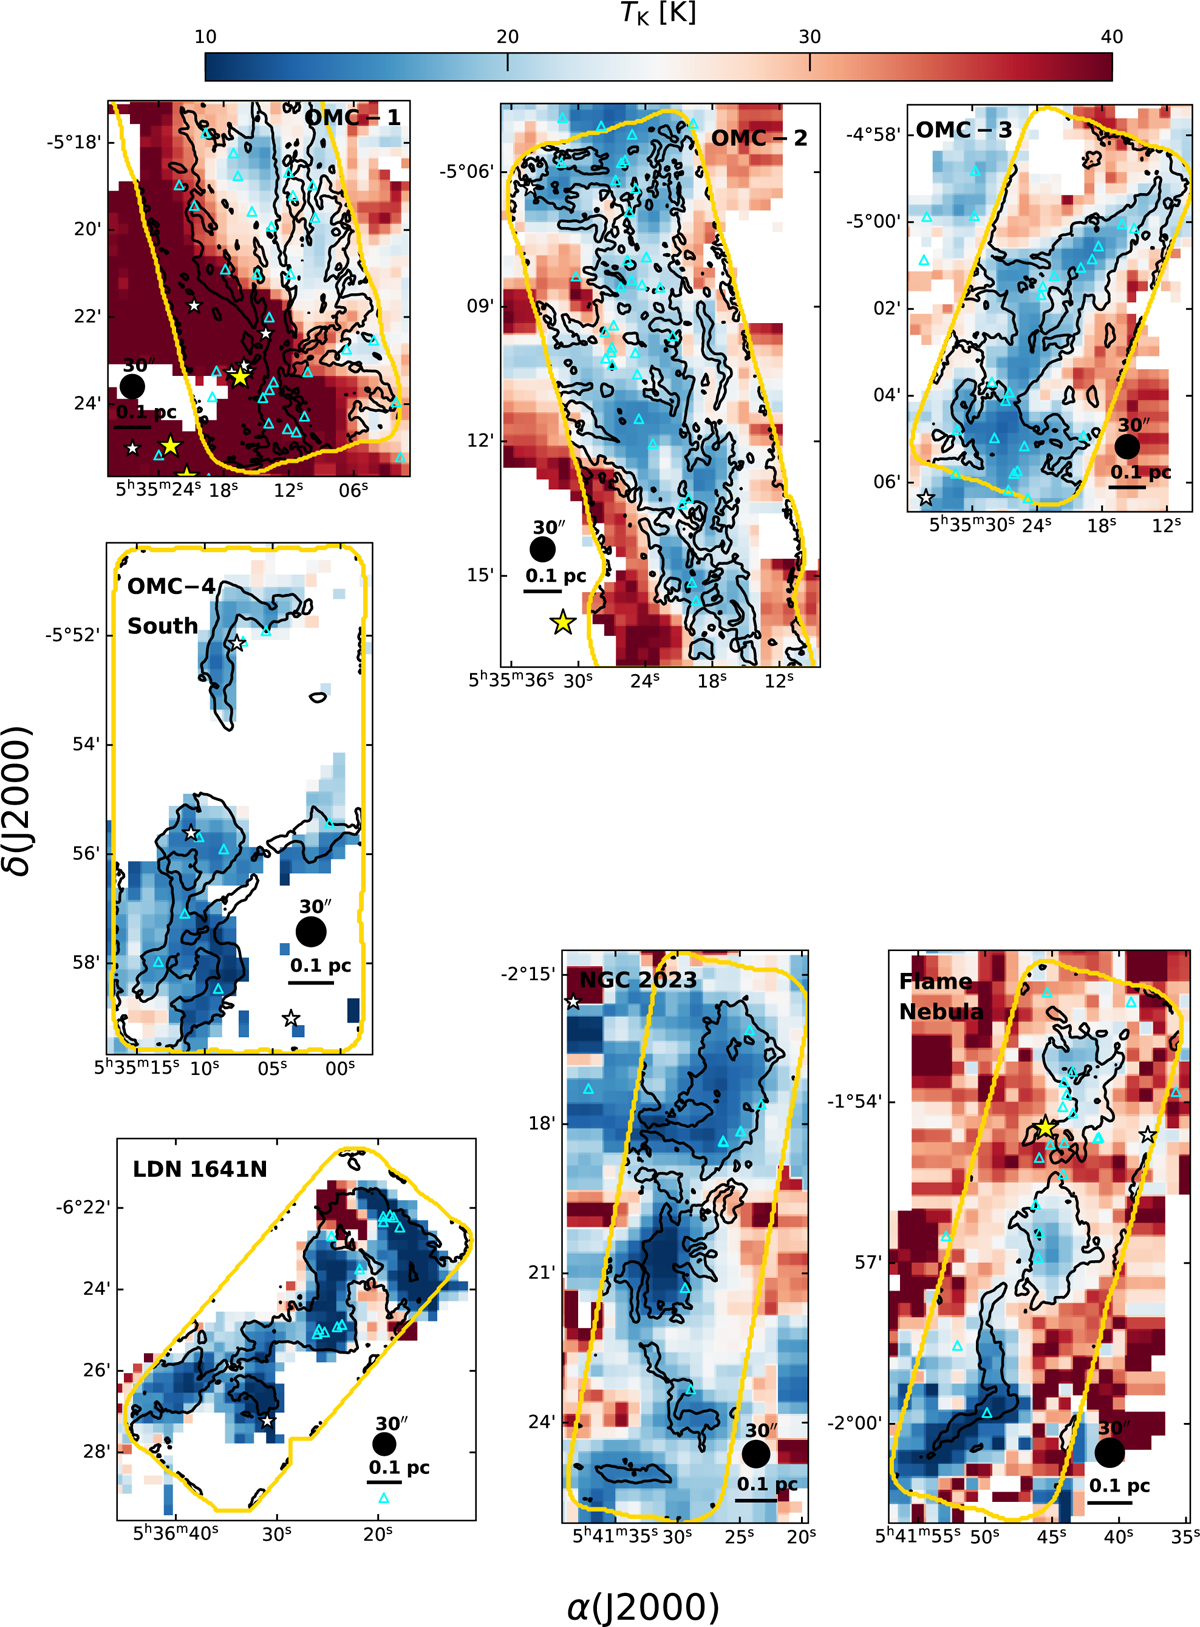
Fig. 2
Download original image
Temperature maps derived from the HCN-to-HNC ratio at 30″ with IRAM-30 m (see Paper I). The fields with I(HNC) < 2 K km s−1 have been masked. The black contours show I(N2H+) ≥ 2.5 K km s−1, three times the noise estimated from the emission-free sub-regions in the maps. Same as in Fig. 1, cyan triangles are the protostellar objects while the yellow and white stars are the O-B stars, respectively.
Current usage metrics show cumulative count of Article Views (full-text article views including HTML views, PDF and ePub downloads, according to the available data) and Abstracts Views on Vision4Press platform.
Data correspond to usage on the plateform after 2015. The current usage metrics is available 48-96 hours after online publication and is updated daily on week days.
Initial download of the metrics may take a while.