Fig. A.2
Download original image
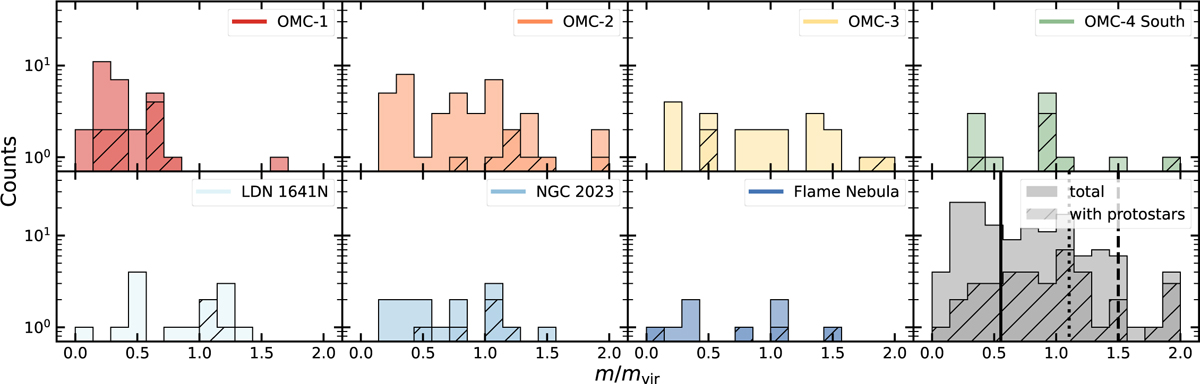
Virial ratios of the Orion fibers obtained per region in our survey (see Sect. 5.3). The fibers are further divided in star-forming (with protostars, hatched histogram) and total (with and without protostars, plain histogram). The grey histogram reports the virial ratios for the survey as a whole, along with the median values for the non-star-forming fibers (solid line) and the star-forming ones (dashed line).
Current usage metrics show cumulative count of Article Views (full-text article views including HTML views, PDF and ePub downloads, according to the available data) and Abstracts Views on Vision4Press platform.
Data correspond to usage on the plateform after 2015. The current usage metrics is available 48-96 hours after online publication and is updated daily on week days.
Initial download of the metrics may take a while.