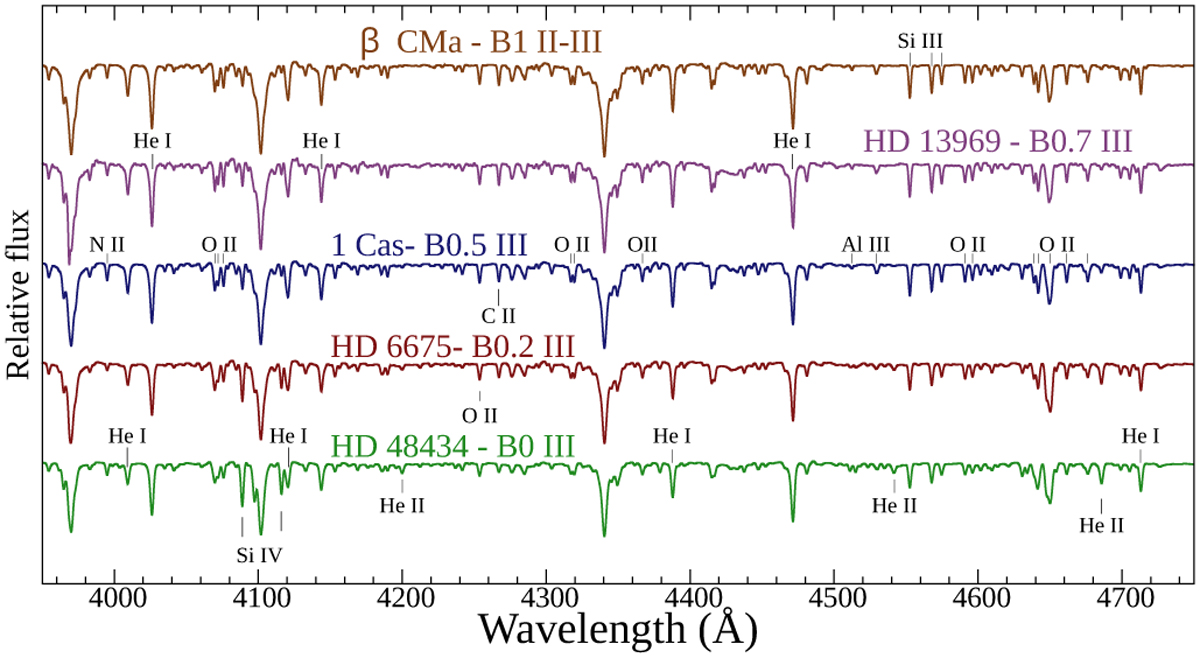
Fig. A.1
Download original image
Spectral sequence of giants between B0 and B1, illustrating the progressive disappearance of the He II lines and the smooth inversion of the Si III/SI IV ratios. Lines used in classification criteria are shown on the top and bottom spectrum. Other metallic lines (after Kilian et al. 1991) are indicated on the middle spectra. See Fig. 3 for more line identifications and compare to Fig. A.2, where a sequence at much higher luminosity over the same spectral range is shown.
Current usage metrics show cumulative count of Article Views (full-text article views including HTML views, PDF and ePub downloads, according to the available data) and Abstracts Views on Vision4Press platform.
Data correspond to usage on the plateform after 2015. The current usage metrics is available 48-96 hours after online publication and is updated daily on week days.
Initial download of the metrics may take a while.