Fig. E.4
Download original image
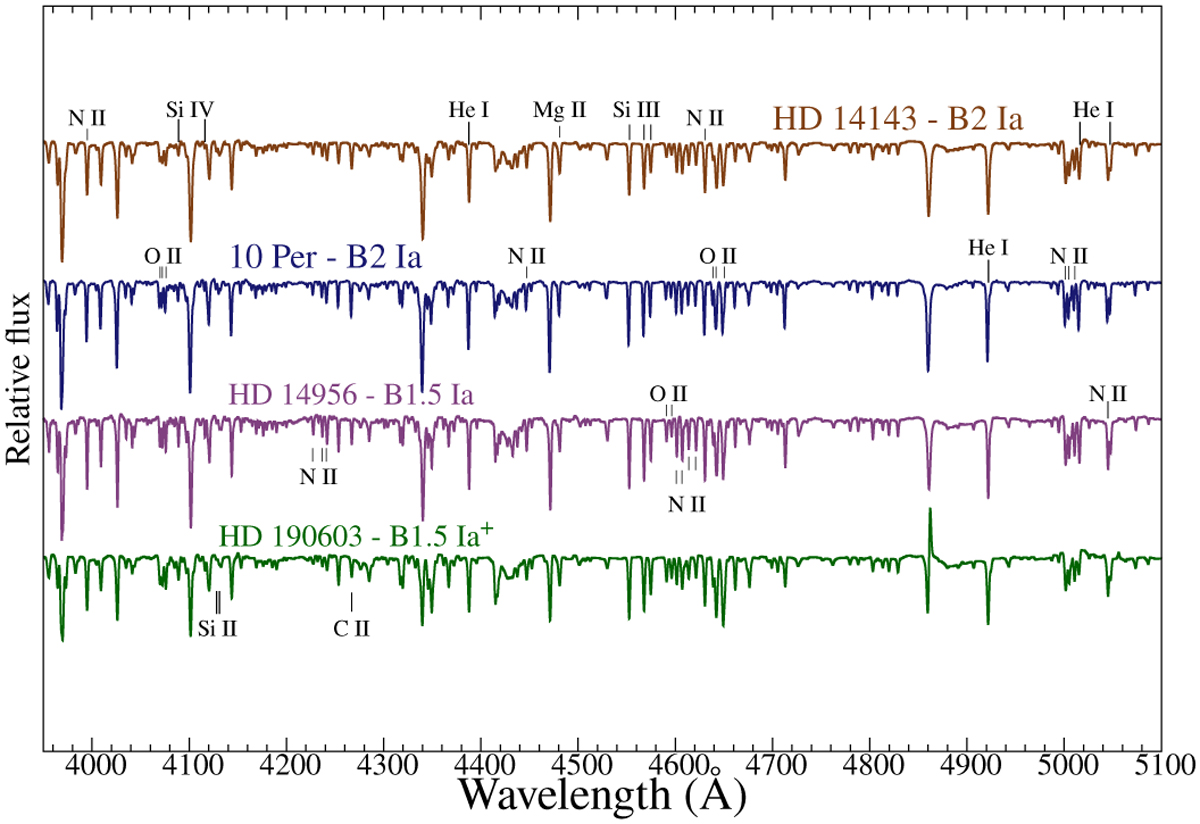
Spectrum of HD 14956, B1.5 Ia compared to two B2Ia super-giants from Per OB 1 and the B1.5 hypergiant HD 190603. The higher temperature of the two lower spectra is reflected in the stronger Si IV lines. The rest of the spectrum is almost indistinguishable. The main differences are due to the mild Carbon deficiency and Nitrogen enhancement of the two B1.5 stars (reflected in the weakened C II 4267 Å and strengthened N II 3995 Å lines). Compare to the more typical B1.5 morphology of HD 13841 in Fig. A.7. Note, however, that, except for the strong N II 3995 Å line, N is much more enhanced in HD 14956 than in the hypergiant.
Current usage metrics show cumulative count of Article Views (full-text article views including HTML views, PDF and ePub downloads, according to the available data) and Abstracts Views on Vision4Press platform.
Data correspond to usage on the plateform after 2015. The current usage metrics is available 48-96 hours after online publication and is updated daily on week days.
Initial download of the metrics may take a while.