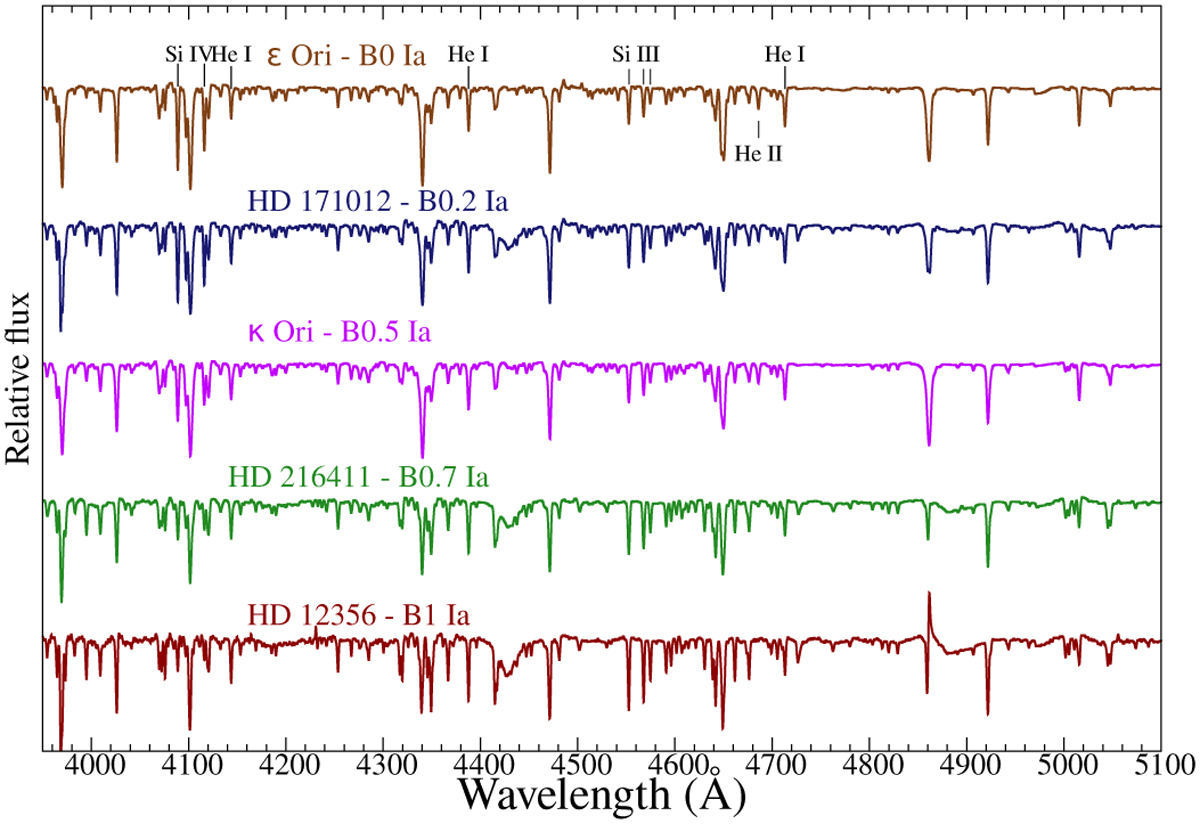
Fig. A.2
Download original image
Spectral sequence for luminous supergiants between BO and B1, illustrating the extreme change in the Si III/Si IV ratios. The main He I lines against which the Si lines are compared for luminosity classification are indicated, as well as the He II 4686 Å line, which decreases in strength as luminosity increases. Based on the shape of the Balmer lines, one would be tempted to assume that the two Orion stars are significantly less luminous than the other three, although this effect might instead be related to weaker mass loss. Compare to Fig. A.1 for the same sequence at lower luminosity.
Current usage metrics show cumulative count of Article Views (full-text article views including HTML views, PDF and ePub downloads, according to the available data) and Abstracts Views on Vision4Press platform.
Data correspond to usage on the plateform after 2015. The current usage metrics is available 48-96 hours after online publication and is updated daily on week days.
Initial download of the metrics may take a while.