Fig. 9
Download original image
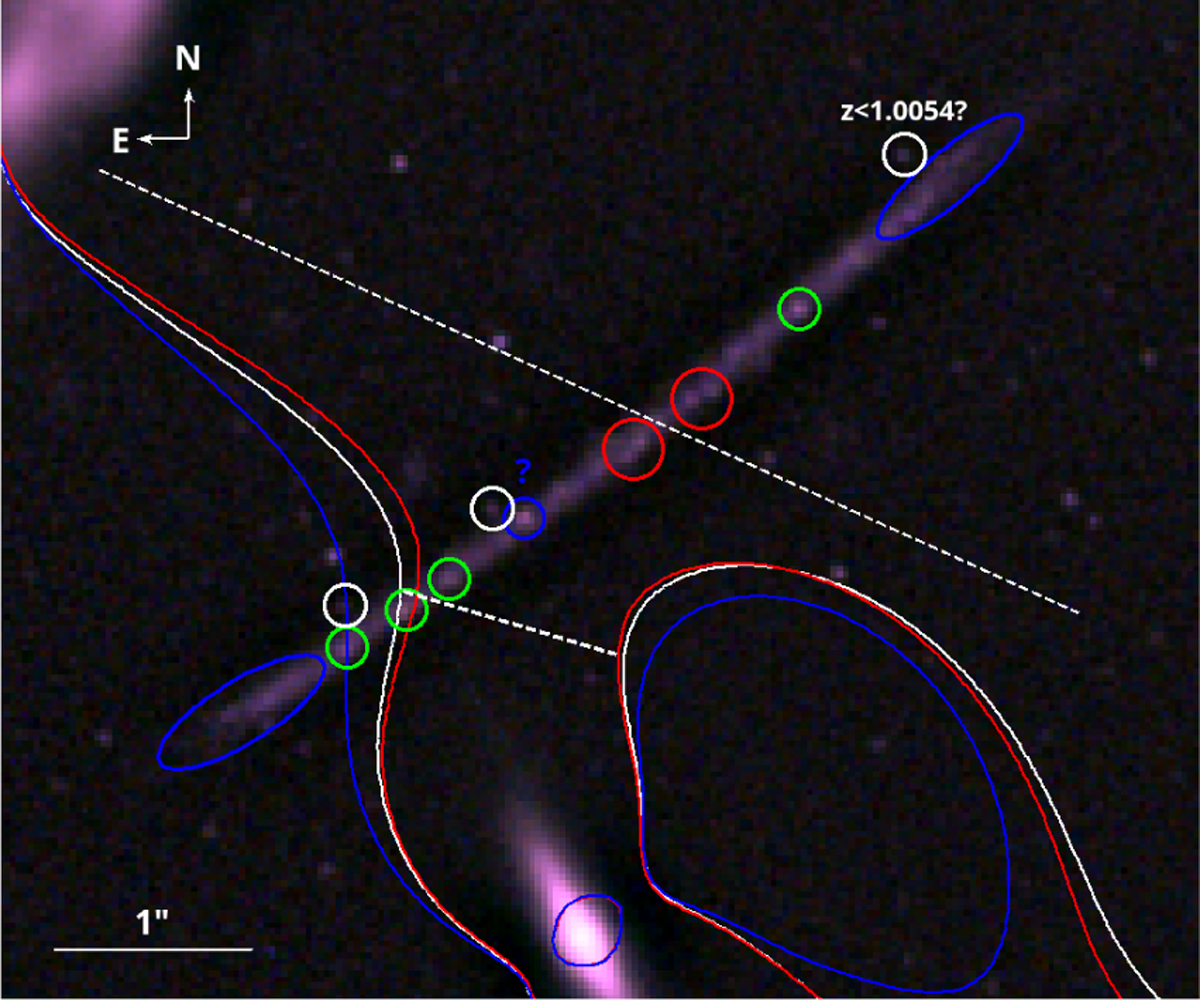
High-pass filtered image of the Spock arc with CCs and the possible interpretation of multiply imaged sources. The white curve is the CC predicted by the full model (systems with rank A+B and adaptive grid with 495 grid points) at z = 1.0054. The image shows multiple unresolved features along the Spock arc. Sources marked with the same color circle are assumed to be the same source that is multiply imaged, and the dashed lines mark the positions of the CC based on these sources. The white circles mark a lensed galaxy candidate at a slightly different redshift. If the mass of the smooth component is reduced slightly in this portion of the lens plane, the main CC would move toward the NW up to the position of the long dashed line (≈0″.5 away). The critical line around the member galaxy in the south of the image would then close (smaller dashed line), naturally producing the triplet marked with three green circles. The red and blue CCs are from two alternative models where the grid configuration is changed allowing a slightly different distribution for the smooth mass component. Because we did not use multiple knots in this arc as constraints, the lensing constraints are insufficient to properly reproduce the multiple crossing positions of the CC.
Current usage metrics show cumulative count of Article Views (full-text article views including HTML views, PDF and ePub downloads, according to the available data) and Abstracts Views on Vision4Press platform.
Data correspond to usage on the plateform after 2015. The current usage metrics is available 48-96 hours after online publication and is updated daily on week days.
Initial download of the metrics may take a while.