Fig. 4
Download original image
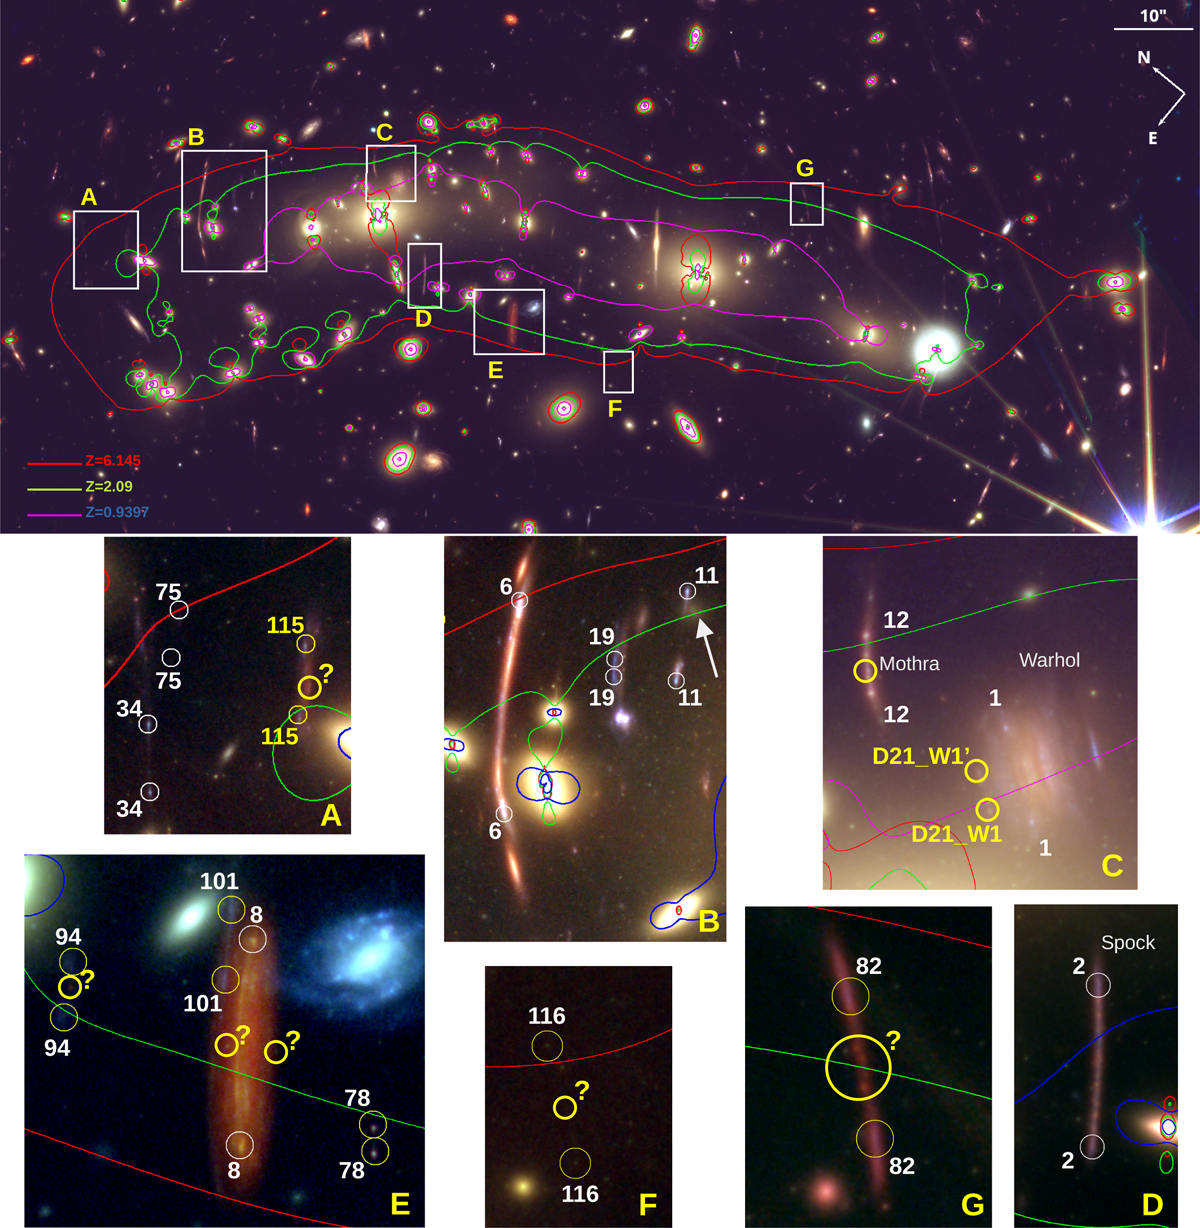
Critical curves from the lens model superposed on the MACS0416 color image. The image scale and orientation are indicated. The red curve is for sources at z = 6.145 (systems 73 and 74), the green curve is for z = 2.091 (System 12), and the magenta curve is for z = 0.9397 (System 1). The image colors have been stretched to better show the distribution of ICL. Panels A through G show enlarged images of areas indicated by white rectangles in the main image. These areas contain some of the most prominent arcs crossing a caustic, where candidate EMOs (marked by thick yellow circles) can be found in JWST images. The CCs in panels A–G are the same as in the larger plot. The numbers in each panel indicate the system ID, and white (rank A) or yellow (rank B) thin circles indicate system counterimages. The lensing properties of these systems are described in more detail in Section 5. Galaxies Warhol (System 1), Spock (System 2), and Mothra (System 12) are shown in panels C and D.
Current usage metrics show cumulative count of Article Views (full-text article views including HTML views, PDF and ePub downloads, according to the available data) and Abstracts Views on Vision4Press platform.
Data correspond to usage on the plateform after 2015. The current usage metrics is available 48-96 hours after online publication and is updated daily on week days.
Initial download of the metrics may take a while.