Fig. 2.
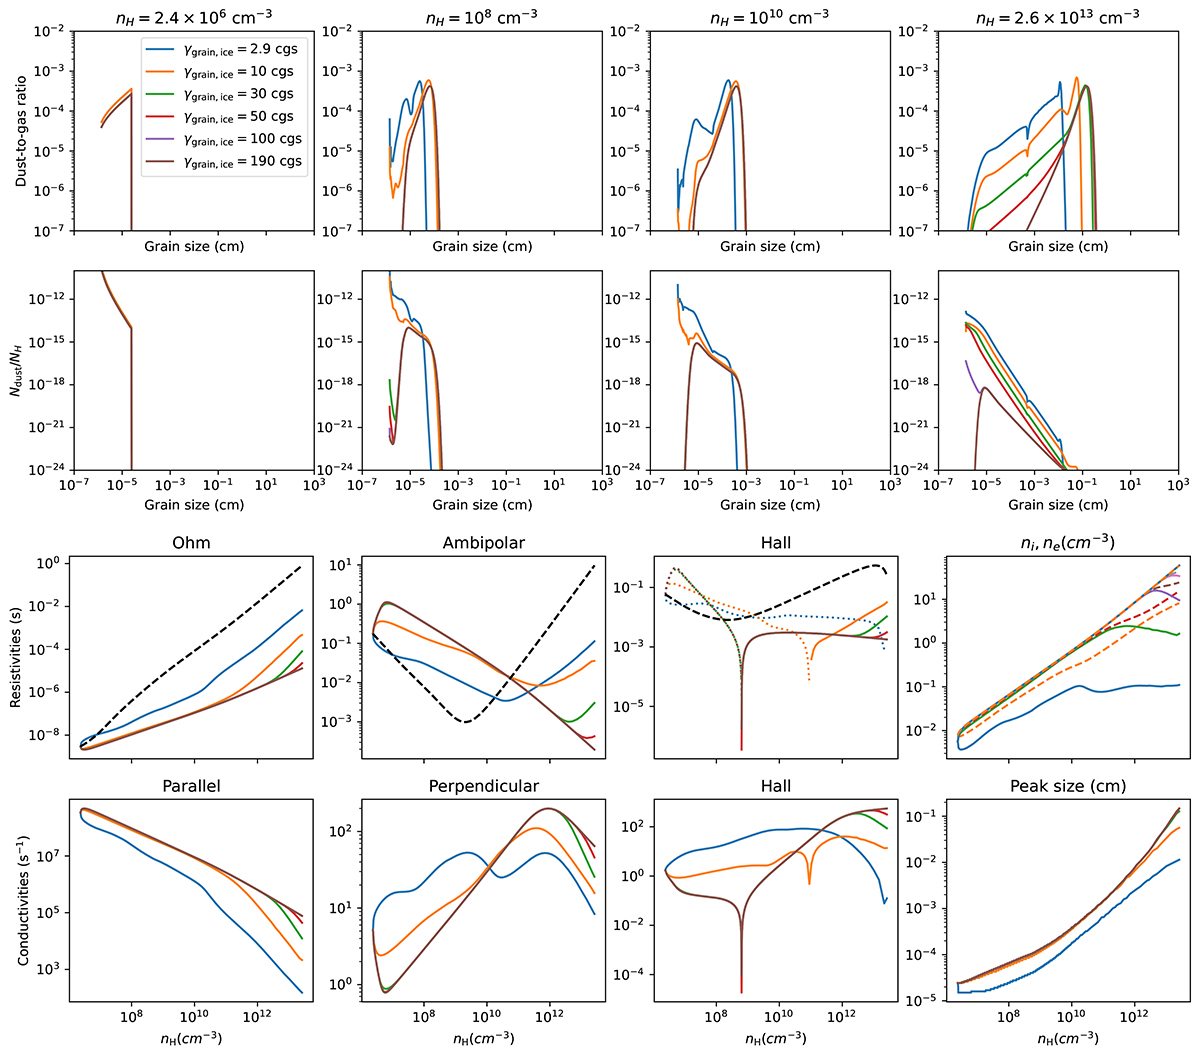
Download original image
Dust distributions at different stages during the collapse. First row: Mass dust-to-gas ratio. Second row: Number dust-to-gas ratio. Third row: Resistivities profile and ion and electron numerical densities (Hall resistivity: dotted line for the negative values and solid line for the positive ones). Dashed black lines: Reference resistivities obtained with a fixed MRN dust distribution. Fourth row: Parallel, perpendicular, and Hall conductivities, and the evolution of the peak size of the dust distribution. Comparison between different values of the grain surface energy expressed in cgs units (erg cm−2).
Current usage metrics show cumulative count of Article Views (full-text article views including HTML views, PDF and ePub downloads, according to the available data) and Abstracts Views on Vision4Press platform.
Data correspond to usage on the plateform after 2015. The current usage metrics is available 48-96 hours after online publication and is updated daily on week days.
Initial download of the metrics may take a while.