Fig. 9.
Download original image
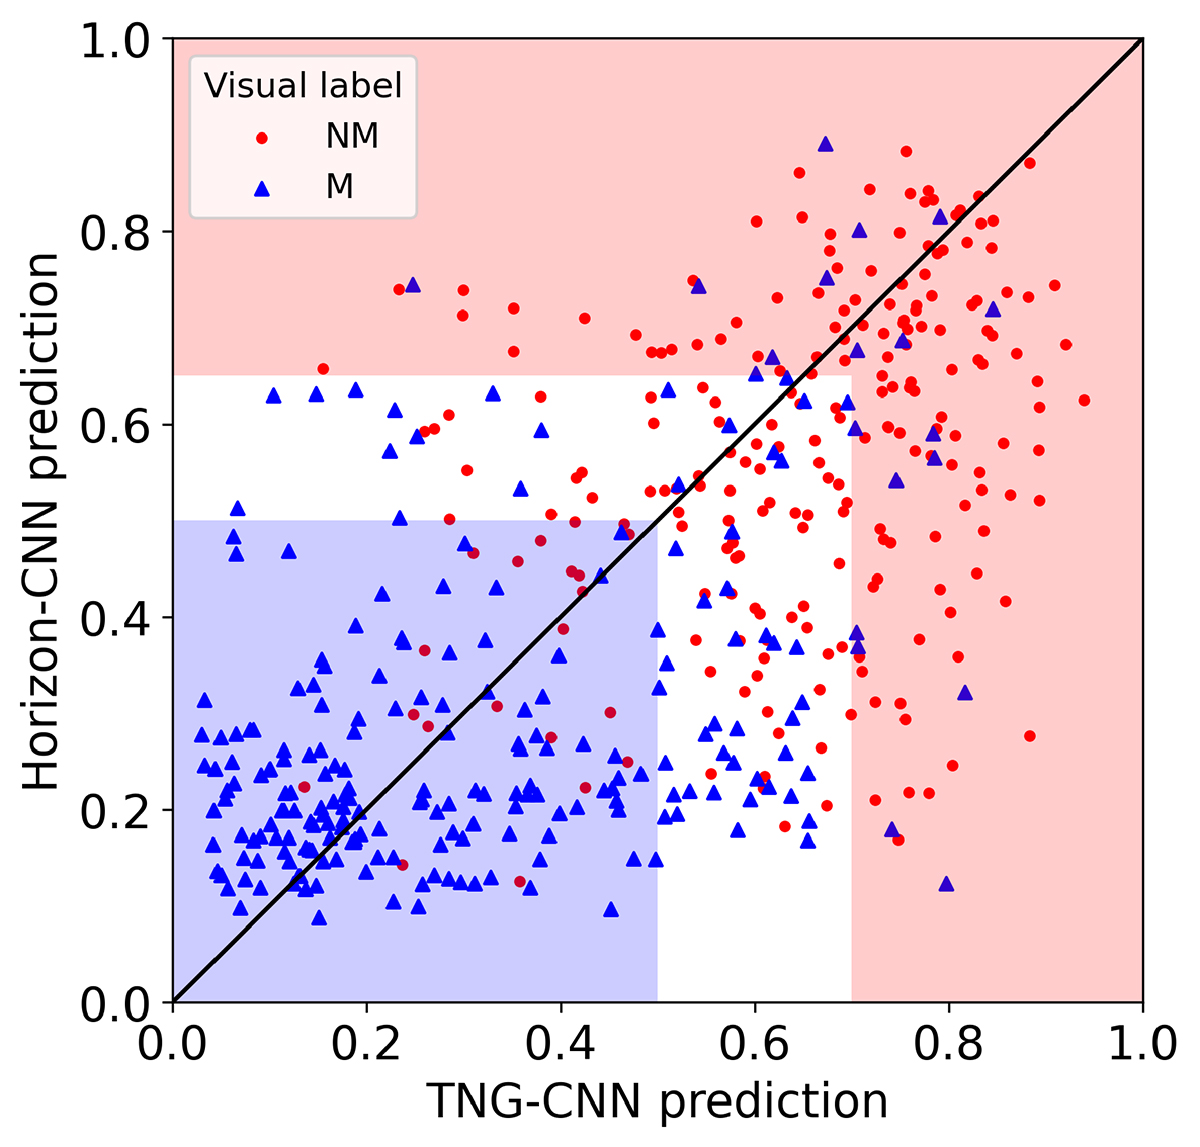
Comparison of the predicted scores from the TNG-CNN and Horizon-CNN for the HSC test set in z-bin 1. Visual labels are given in the legend. NM denotes a non-merger (red dots) and M denotes a merger (blue triangles). The red and blue shaded areas represent the combined model’s non-merger and merger class definitions with two thresholds.
Current usage metrics show cumulative count of Article Views (full-text article views including HTML views, PDF and ePub downloads, according to the available data) and Abstracts Views on Vision4Press platform.
Data correspond to usage on the plateform after 2015. The current usage metrics is available 48-96 hours after online publication and is updated daily on week days.
Initial download of the metrics may take a while.