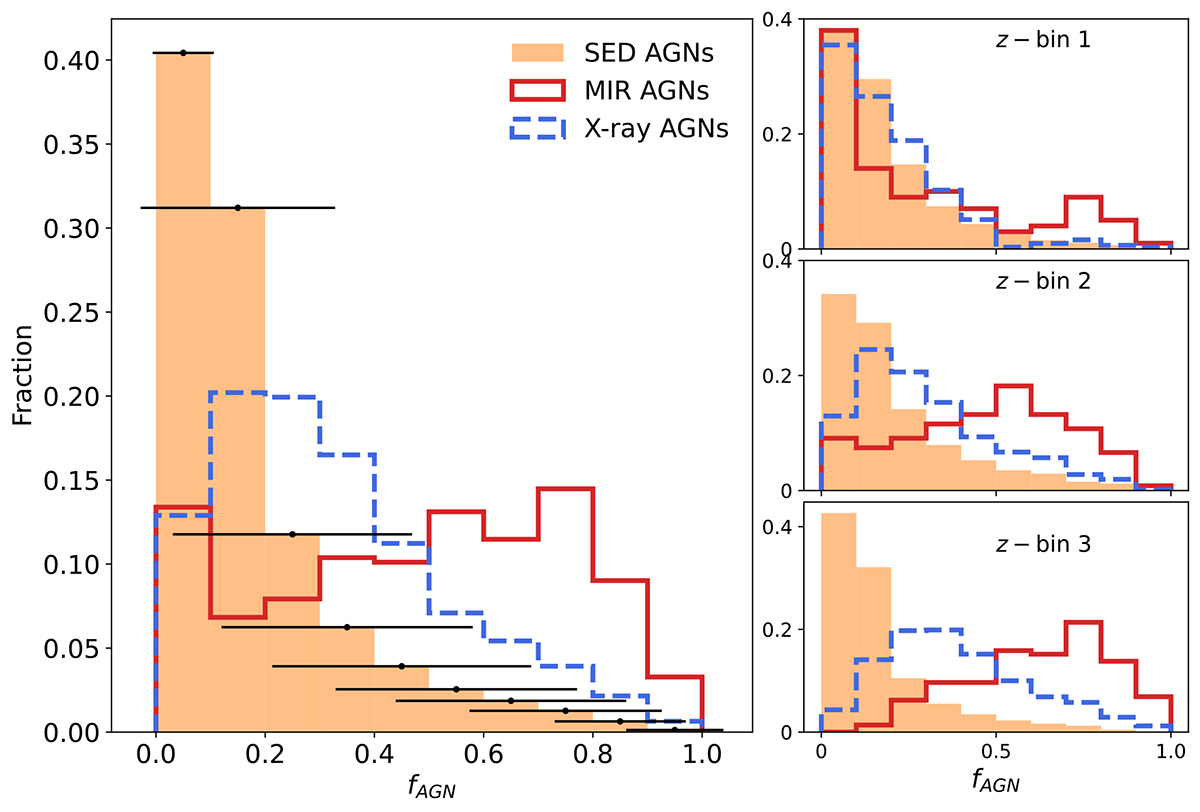
Fig. 7.
Download original image
AGN fraction distributions for the SED AGNs (orange bins), MIR AGNs (solid red line), and X-ray AGNs (dashed blue line). Horizontal bars indicate the median uncertainty in fAGN in each bin. The left panel displays the distributions over the entire redshift range and the three panels on the right in individual z-bins. The sample shown here contains only galaxies detected in the MIR and/or in the X-ray.
Current usage metrics show cumulative count of Article Views (full-text article views including HTML views, PDF and ePub downloads, according to the available data) and Abstracts Views on Vision4Press platform.
Data correspond to usage on the plateform after 2015. The current usage metrics is available 48-96 hours after online publication and is updated daily on week days.
Initial download of the metrics may take a while.