Fig. D.2.
Download original image
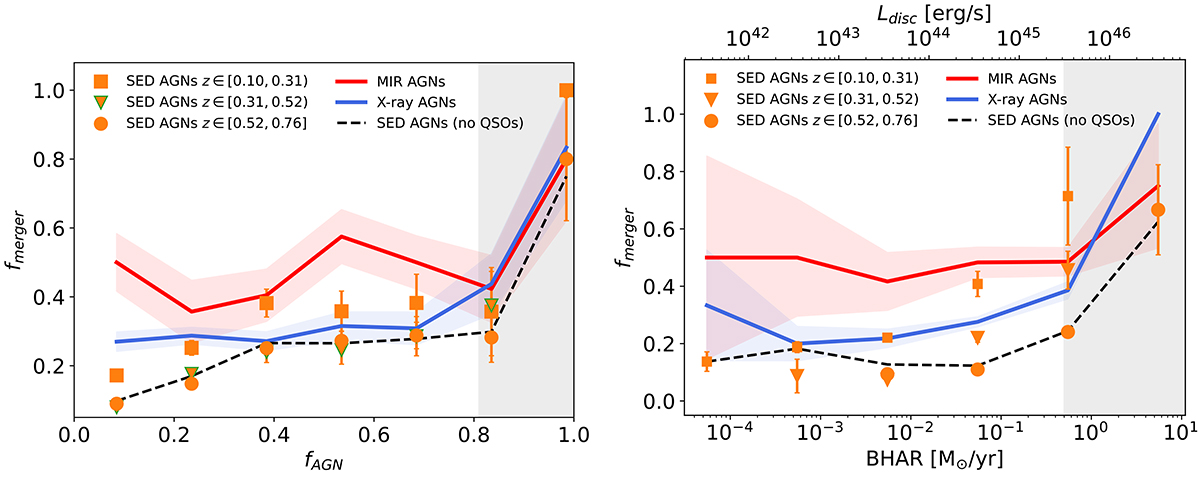
Same as Fig. 15 but for the sample of galaxies where quasars have been visually inspected. The dashed black lines indicate the trends obtained after excluding all 67 classified optical quasars. Left: Merger fraction fmerger as a function of fAGN. Right:fmerger as a function of BHAR or the equivalent AGN bolometric luminosity Ldisc. These trends are similar to the ones presented for the main sample in Fig. 15. The overall trends hold even if we exclude all quasars from our sample.
Current usage metrics show cumulative count of Article Views (full-text article views including HTML views, PDF and ePub downloads, according to the available data) and Abstracts Views on Vision4Press platform.
Data correspond to usage on the plateform after 2015. The current usage metrics is available 48-96 hours after online publication and is updated daily on week days.
Initial download of the metrics may take a while.