Fig. B.1.
Download original image
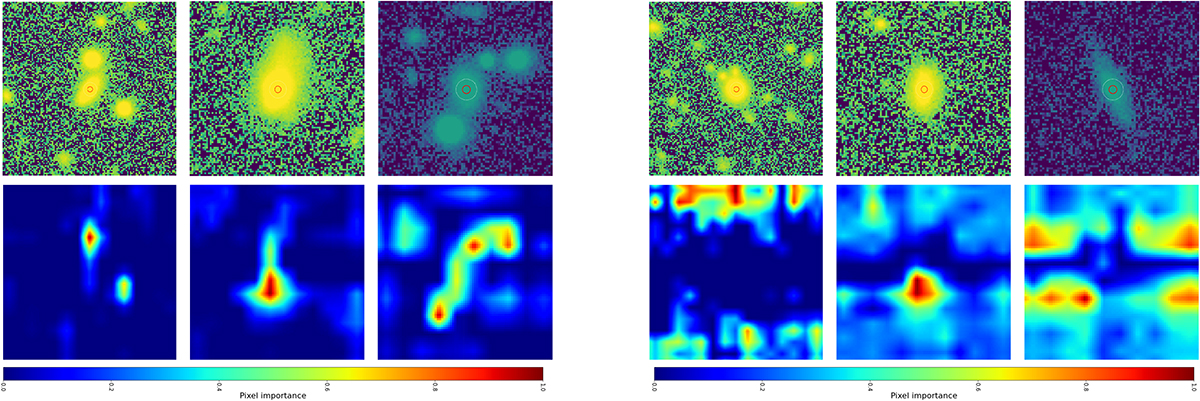
Examples of HSC i−band images and corresponding activation maps of the TNG-CNN. The top row shows examples of mergers (images 1 to 3) and non-mergers (images 4 to 6) ordered in increasing z-bin. The bottom row shows the activation maps. The redder the pixel colour the more the CNN pays attention to that region. The HSC images are cut and resized as detailed in Sect. 2.3.
Current usage metrics show cumulative count of Article Views (full-text article views including HTML views, PDF and ePub downloads, according to the available data) and Abstracts Views on Vision4Press platform.
Data correspond to usage on the plateform after 2015. The current usage metrics is available 48-96 hours after online publication and is updated daily on week days.
Initial download of the metrics may take a while.