Fig. 14.
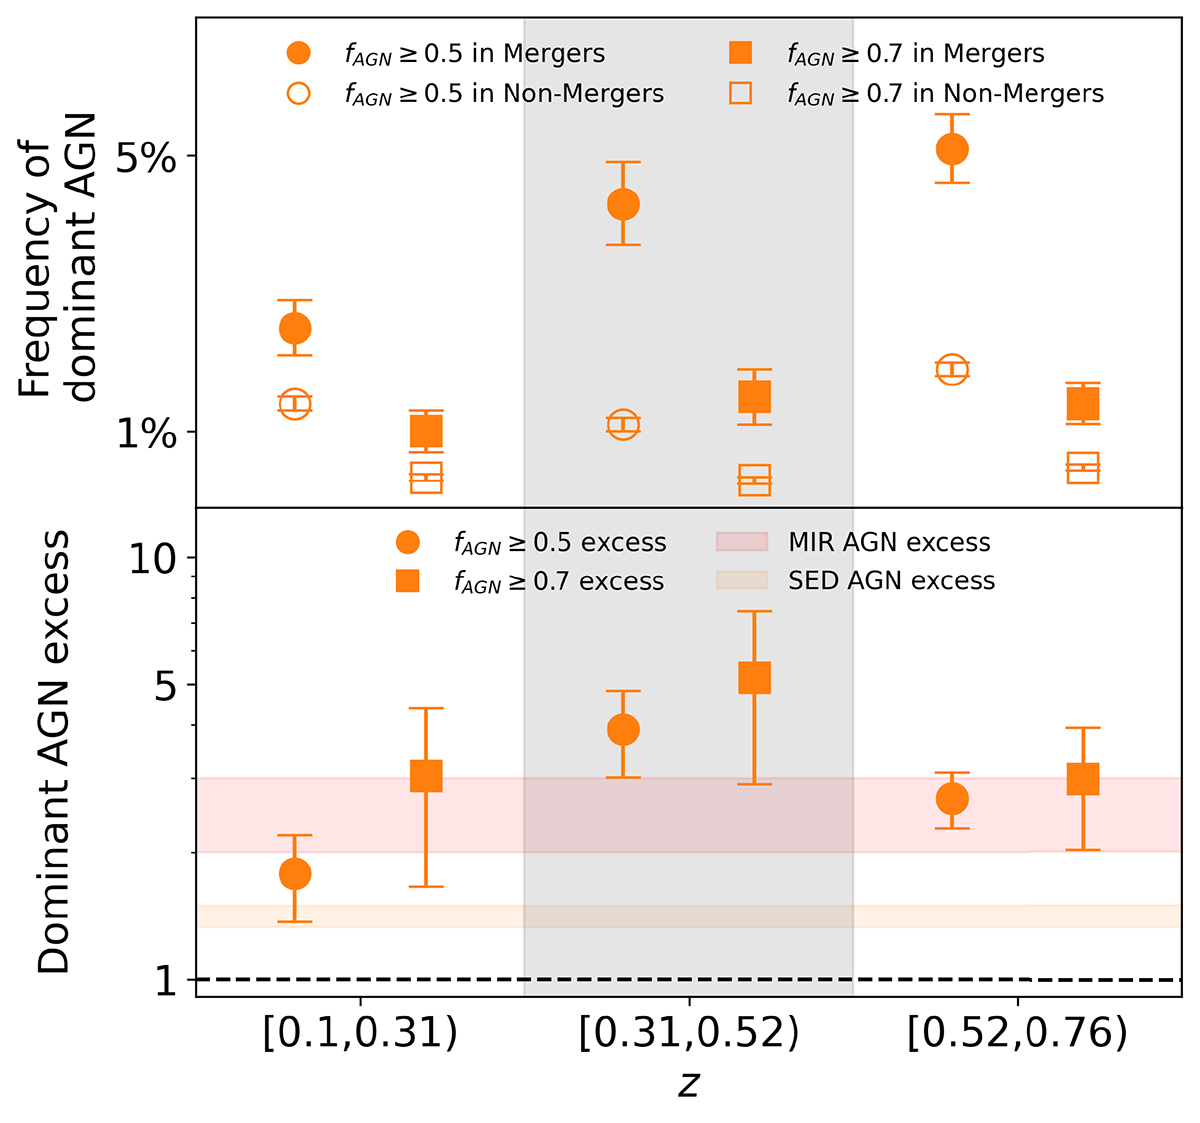
Download original image
Dominant subset of the SED AGNs. Top: Frequency of the SED AGNs with fAGN ≥ 0.5 (circles) or fAGN ≥ 0.7 (squares) in mergers (filled symbols) and non-mergers (empty symbols) as a function of redshift. Uncertainties are estimated using binomial statistics. Bottom: Excess of the dominant SED AGNs in mergers. The red and orange bands display the AGN excess for the MIR and SED AGNs as a whole, respectively (Fig. 11).
Current usage metrics show cumulative count of Article Views (full-text article views including HTML views, PDF and ePub downloads, according to the available data) and Abstracts Views on Vision4Press platform.
Data correspond to usage on the plateform after 2015. The current usage metrics is available 48-96 hours after online publication and is updated daily on week days.
Initial download of the metrics may take a while.