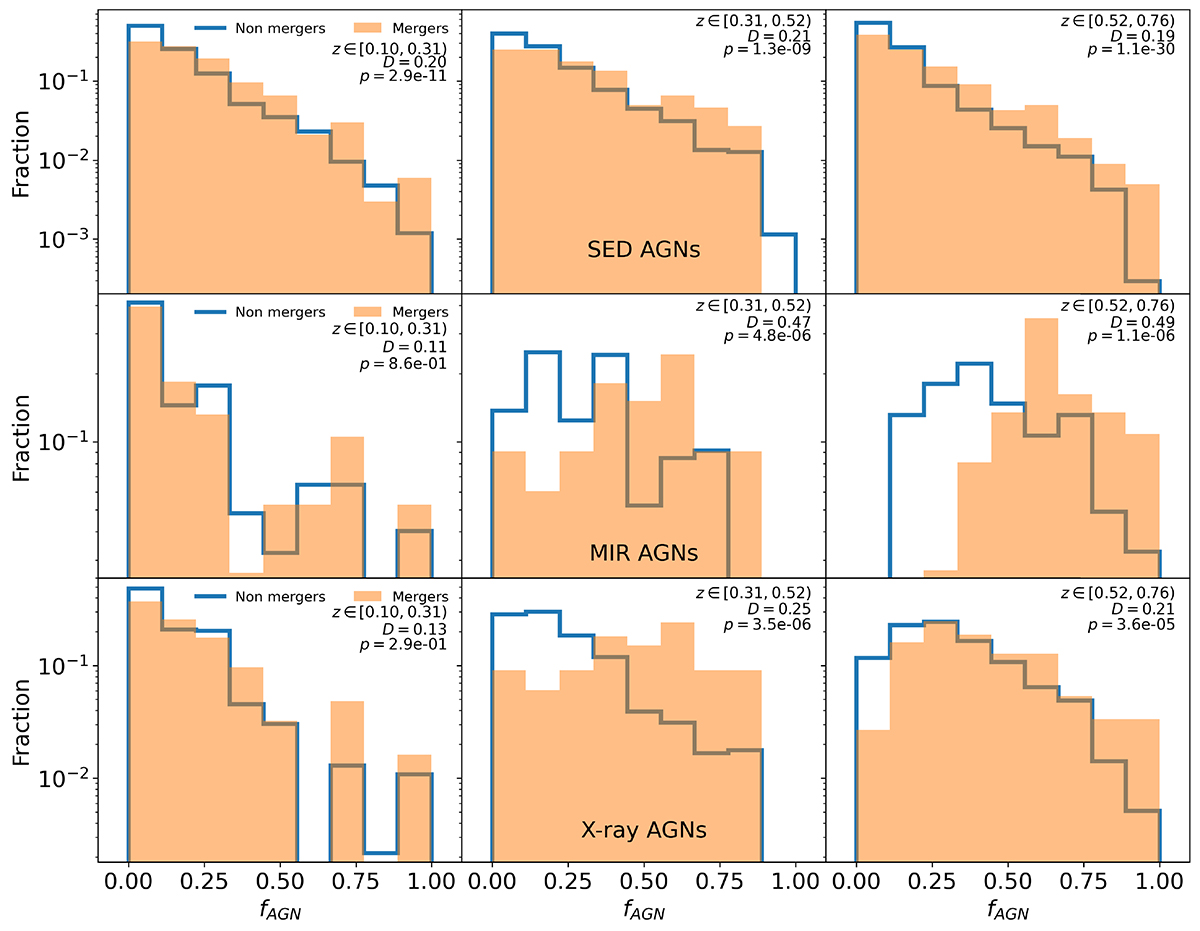
Fig. 13.
Download original image
Normalised distributions of AGN fraction in mergers (orange) and non-mergers (blue), as a function of redshift (z-bin 1: left; z-bin 2: middle; z-bin 3: right) and AGN type (SED AGN: top; MIR AGN: bottom). In each panel, we show the results of a KS test, where D is the test result and p is the corresponding p−value. For SED AGNs, the fAGN distribution in mergers is considerably different from that in non-mergers in all z-bins. MIR AGNs have different merger and non-merger distributions at z ≥ 0.31.
Current usage metrics show cumulative count of Article Views (full-text article views including HTML views, PDF and ePub downloads, according to the available data) and Abstracts Views on Vision4Press platform.
Data correspond to usage on the plateform after 2015. The current usage metrics is available 48-96 hours after online publication and is updated daily on week days.
Initial download of the metrics may take a while.