Fig. 12.
Download original image
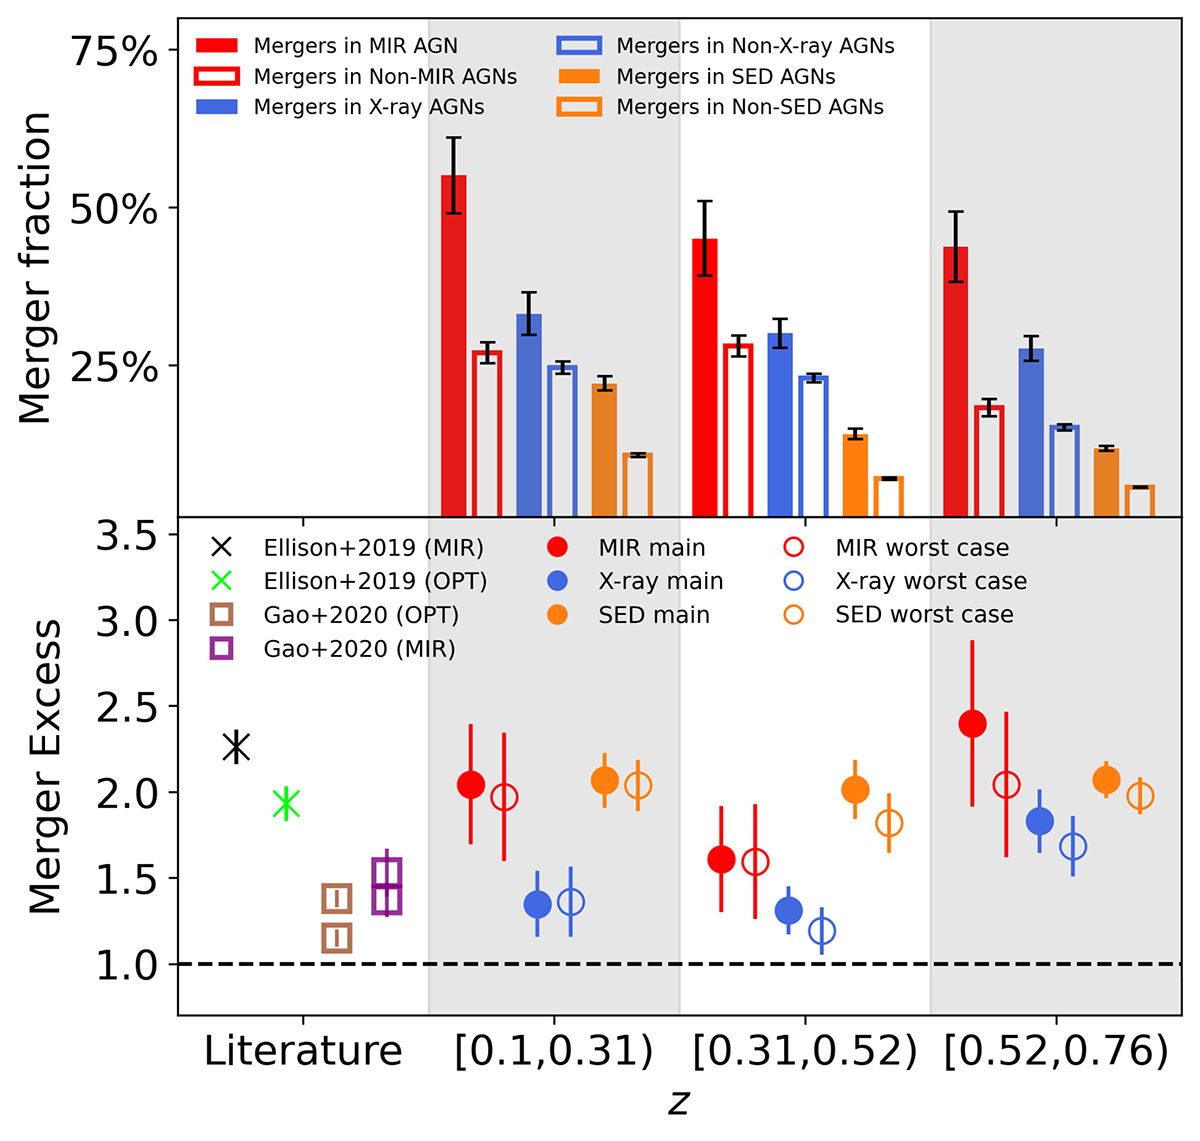
Merger fraction in AGNs vs non-AGNs. Top: Merger fraction in MIR, X-ray, and SED AGNs and the respective non-AGN control samples per z-bin. Filled bars indicate the merger fractions for MIR (red), X-ray AGNs (blue), and SED AGNs (orange), respectively. Empty bars correspond to the merger fractions in the non-AGN controls. Errors are calculated through binomial statistics. Bottom: Ratio of the merger fraction in AGNs relative to non-AGN controls (i.e. the merger excess) for the main classification (filled symbols) and the worst-case scenario (empty symbols). Dashed line indicates no merger excess. First column displays previous literature results.
Current usage metrics show cumulative count of Article Views (full-text article views including HTML views, PDF and ePub downloads, according to the available data) and Abstracts Views on Vision4Press platform.
Data correspond to usage on the plateform after 2015. The current usage metrics is available 48-96 hours after online publication and is updated daily on week days.
Initial download of the metrics may take a while.