Fig. 8
Download original image
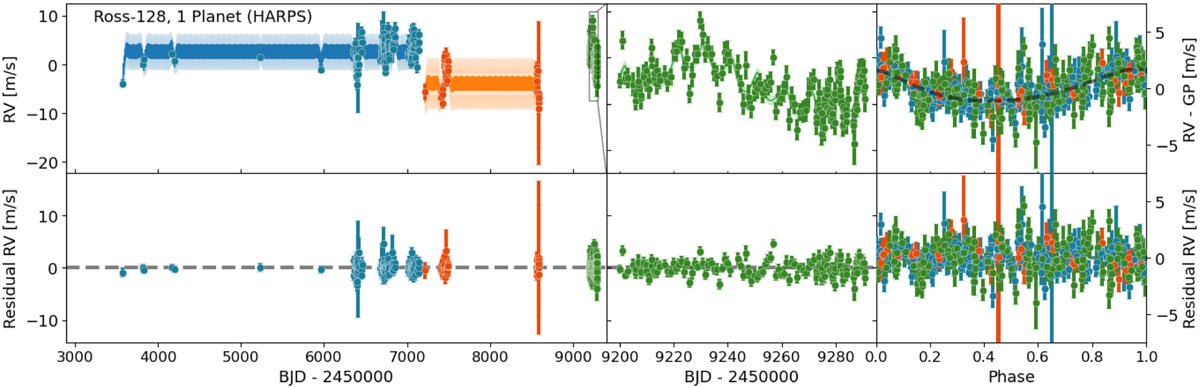
Best fit of the 1 eccentric planet + GP-SHO model (which includes instrumental offsets) in the left panel for Ross 128 (top) and the residuals (bottom). The model and RV data are separated by a small difference in color shade and the uncertainty of the model fit indicated by the more transparent region. The colors indicate the pre-fiber change (blue), post-fiber change (orange), and post-warmup (green) HARPS instrument seasons. The model parameters can be found in Table 4. The gray box marks the extent of the zoomed sub-panel. Zoom into the region of densest observations marked by the gray box in the left panel (middle). Phase-folded, activity subtracted, and instrumental offset corrected RV (right).
Current usage metrics show cumulative count of Article Views (full-text article views including HTML views, PDF and ePub downloads, according to the available data) and Abstracts Views on Vision4Press platform.
Data correspond to usage on the plateform after 2015. The current usage metrics is available 48-96 hours after online publication and is updated daily on week days.
Initial download of the metrics may take a while.