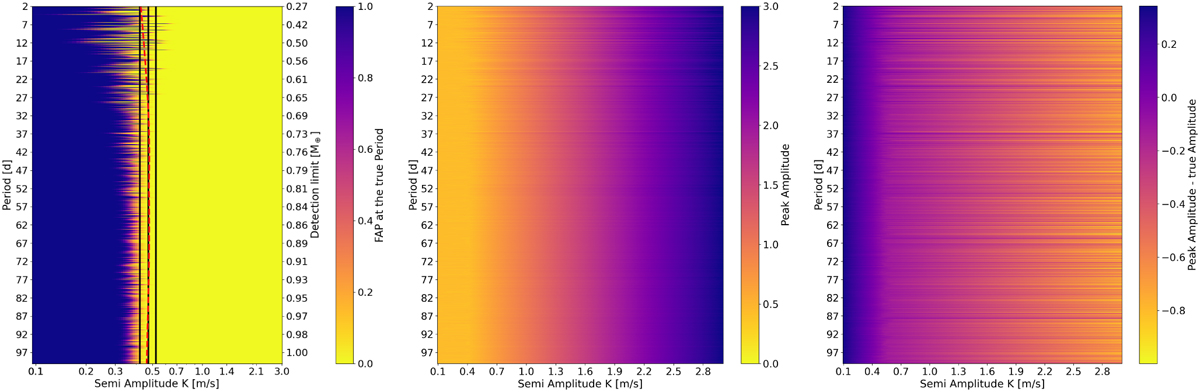
Fig. 10
Download original image
Grid of detections from GLS periodograms for planetary signals injected into the Ross 128 residual RVs. The left panel shows a mean detection boundary (black line plus-minus one standard deviation) and a SavGol smoothing (red line) are marked and the grid colored for the false-alarm-probability (FAP) at the true, injected period for zero eccentricity. The determined limit does not change significantly when the BIC is used in place of the FAP or on randomization of the orbital parameters within reasonable bounds (See Sect. 5.3). The zero eccentricity grid is colored for the RV Semi-amplitude of the strongest periodogram peak in each model (middle). A striped pattern of systematic offsets depending on the injected period is visible. The grid for e = 0.5 is colored for difference of the RV Semi-amplitude of the strongest periodogram peak in each model and the injected semi-amplitude (right). A systematic offset of the recovered semi-amplitude is apparent.
Current usage metrics show cumulative count of Article Views (full-text article views including HTML views, PDF and ePub downloads, according to the available data) and Abstracts Views on Vision4Press platform.
Data correspond to usage on the plateform after 2015. The current usage metrics is available 48-96 hours after online publication and is updated daily on week days.
Initial download of the metrics may take a while.