Fig. 9.
Download original image
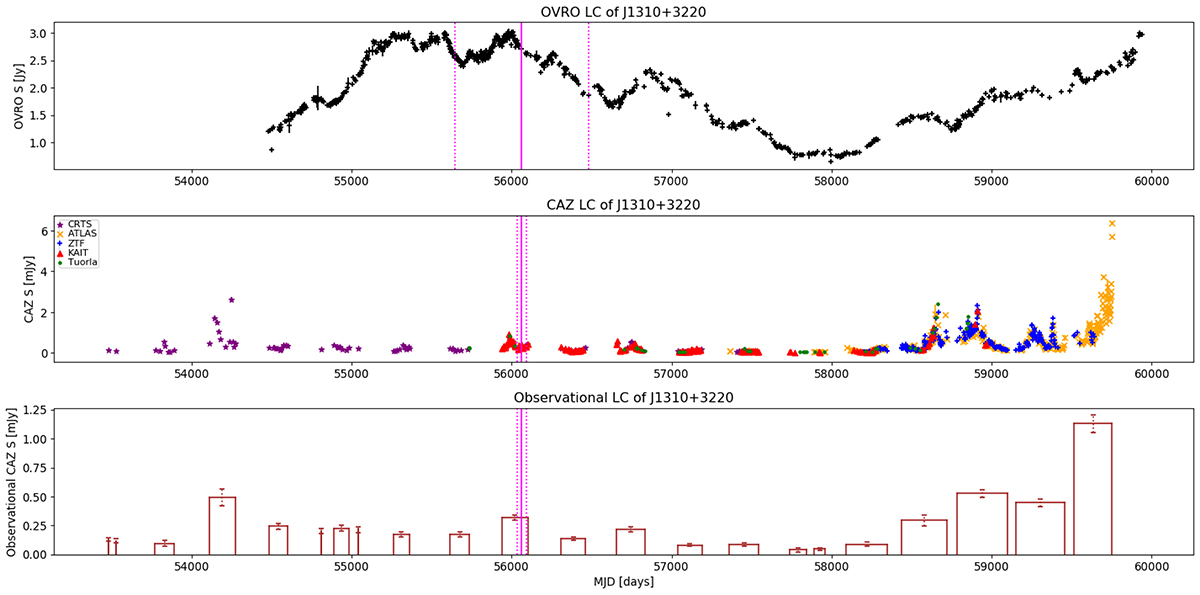
OVRO (radio), CAZ (optical), and observational CAZ light curves of the blazar J1310+3220 (alias: 5BZU J1310+3220, 4FGL J1310.5+3221, B2 1308+32.6) given from top to bottom, respectively. The horizontal axis gives time in Modified Julian Date (MJD) and the vertical axis gives flux density (given in Jy in case of radio and mJy in case of optical). The vertical lines show the arrival time of a spatially associated neutrino, IC120515A. The dotted vertical lines show the AI time window centered around the neutrino arrival time. This is a somewhat spatially accurate neutrino event with Ωenlarged = 8.37 deg2 and 𝒮 = 0.613. For this event, the blazar was flaring in the radio (AIR = 1.42 & wAIR = 0.87) and optical (AIO = 1.29 & wAIO = 0.79) bands simultaneously. This association, J1310+3220–IC120515A, only occurs when considering the enlarged error region scenario because the blazar is just outside of the IceCube reported 90% confidence level error region by 0.01°.
Current usage metrics show cumulative count of Article Views (full-text article views including HTML views, PDF and ePub downloads, according to the available data) and Abstracts Views on Vision4Press platform.
Data correspond to usage on the plateform after 2015. The current usage metrics is available 48-96 hours after online publication and is updated daily on week days.
Initial download of the metrics may take a while.