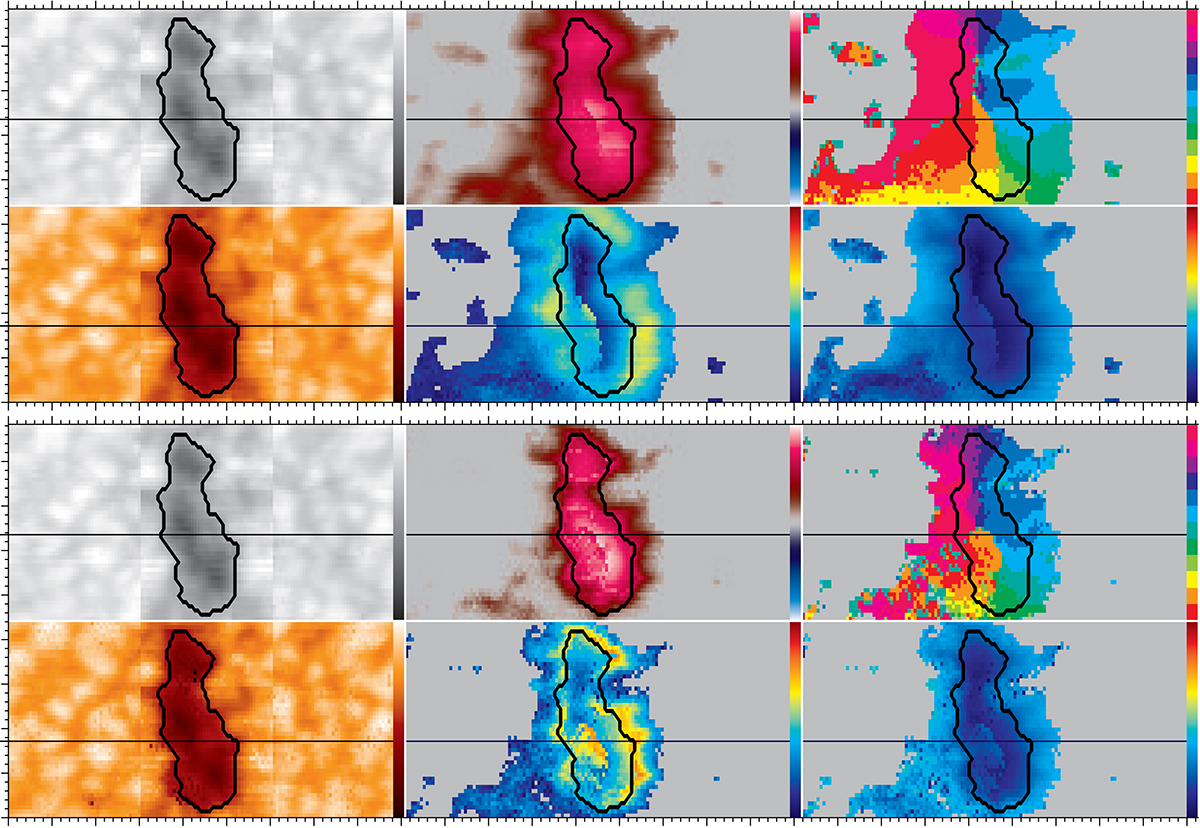
Fig. 7.
Download original image
Maps of six physical parameters derived for the Si I line (top two rows) and Ca I line (bottom two rows) using the SIR code for the GRIS IFU mosaic starting at 08:02 UT on 29 May: normalized intensity I/I0 (0.7 − 1.05), vertical component of magnetic field strength Bz (±1500 G), magnetic field azimuth ϕ (±180°), temperature at τ = 0 (5500 K–7000 K), horizontal component of magnetic field strength Bhor (0 G–1200 G), and magnetic field inclination γ (0°–180°) (top-left to bottom-right). The ranges for all physical parameters are depicted as colored bars on the right. The polarization signal in the gray region is below the noise level. Bz, ϕ, and γ are in the local reference frame. The major tick-marks represent 2″ on both x- and y-axis covering the FOV of 18″ × 9″ for each map. Animations showing the evolution of the pore are available online for the Si I and Ca I lines.
Current usage metrics show cumulative count of Article Views (full-text article views including HTML views, PDF and ePub downloads, according to the available data) and Abstracts Views on Vision4Press platform.
Data correspond to usage on the plateform after 2015. The current usage metrics is available 48-96 hours after online publication and is updated daily on week days.
Initial download of the metrics may take a while.