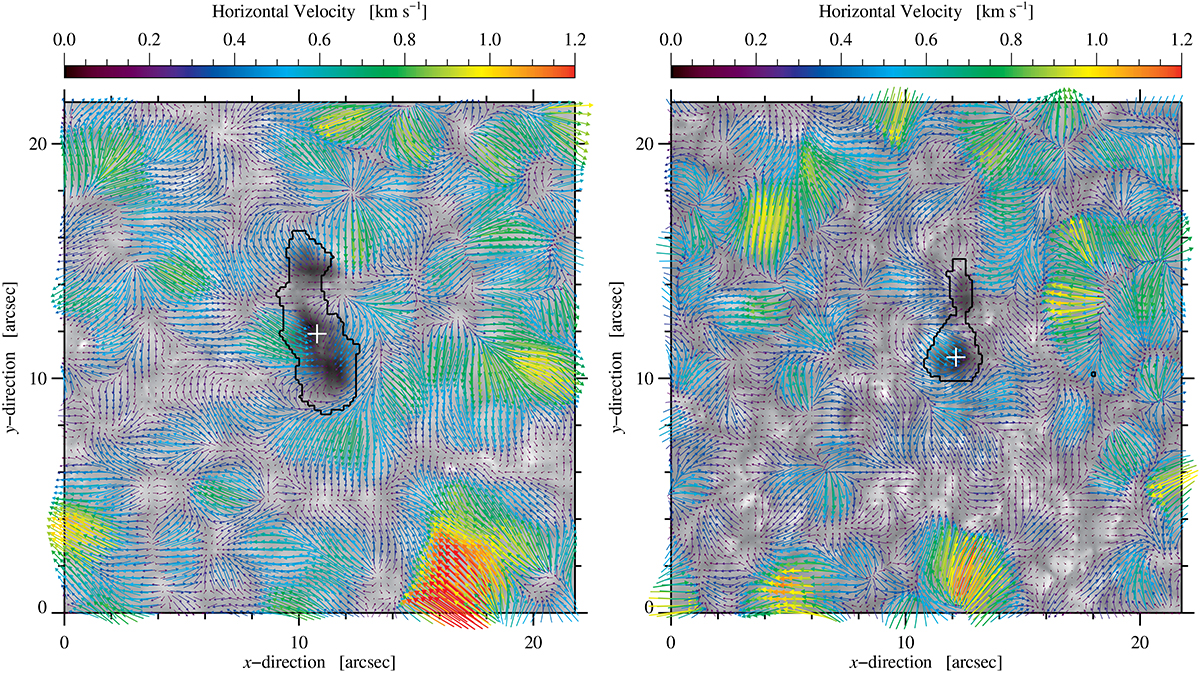
Fig. 5.
Download original image
Average horizontal proper motions based on LCT applied to HiFI G-band images acquired on 29 May (left) and on 6 June (right). The rainbow-colored arrows represent the direction and magnitude of the velocities. Black contours in the panel mark the pore borders. These contours are generated using GRIS continuum images. The white plus sign on both panels marks the centers of the pores around which the radial averages were taken.
Current usage metrics show cumulative count of Article Views (full-text article views including HTML views, PDF and ePub downloads, according to the available data) and Abstracts Views on Vision4Press platform.
Data correspond to usage on the plateform after 2015. The current usage metrics is available 48-96 hours after online publication and is updated daily on week days.
Initial download of the metrics may take a while.