Fig. 3.
Download original image
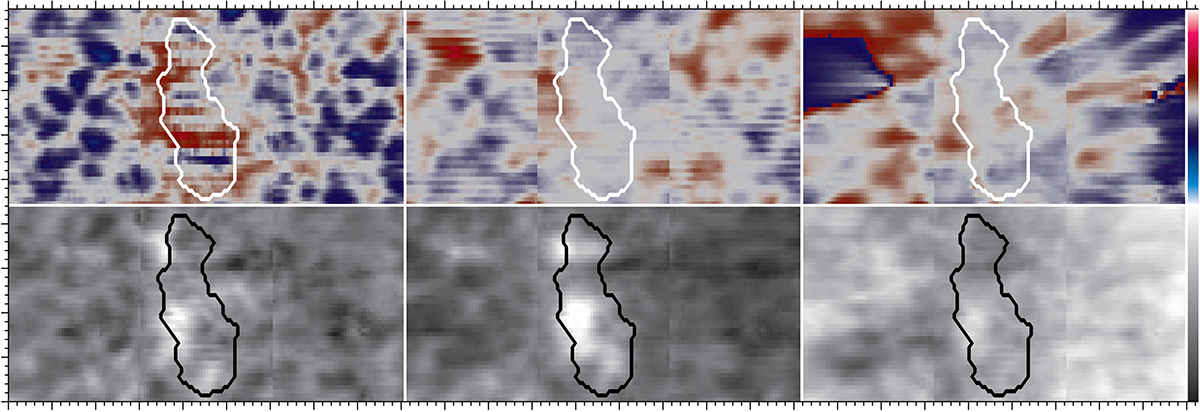
LOS Doppler velocities (top) and line-core intensity (bottom) derived from the GRIS IFU mosaic at the Ca I, Si I, and He I lines (left to right) starting at 08:02 UT on 29 May. The major tick-marks represent 2″ on both the x- and y-axis covering a FOV of 18″ × 9″ for each map. The color bar on the top-right shows the velocity range of ±3 km s−1 for the Ca I and Si I lines and of ±20 km s−1 for the He I lines. The color bar on the bottom-right shows the line-core intensity in the range of (0.80–1.04), (0.36–0.56), and (0.60–1.04) for the Ca I, Si I, and He I lines, respectively. The black and white contours outline the pore. The contours shown here and in all subsequent figures are extracted from the GRIS continuum mosaic at 08:02 UT on 29 May. The artifacts seen in the maps are discussed in Sect. 2. An animation showing the evolution of the pore is available online.
Current usage metrics show cumulative count of Article Views (full-text article views including HTML views, PDF and ePub downloads, according to the available data) and Abstracts Views on Vision4Press platform.
Data correspond to usage on the plateform after 2015. The current usage metrics is available 48-96 hours after online publication and is updated daily on week days.
Initial download of the metrics may take a while.