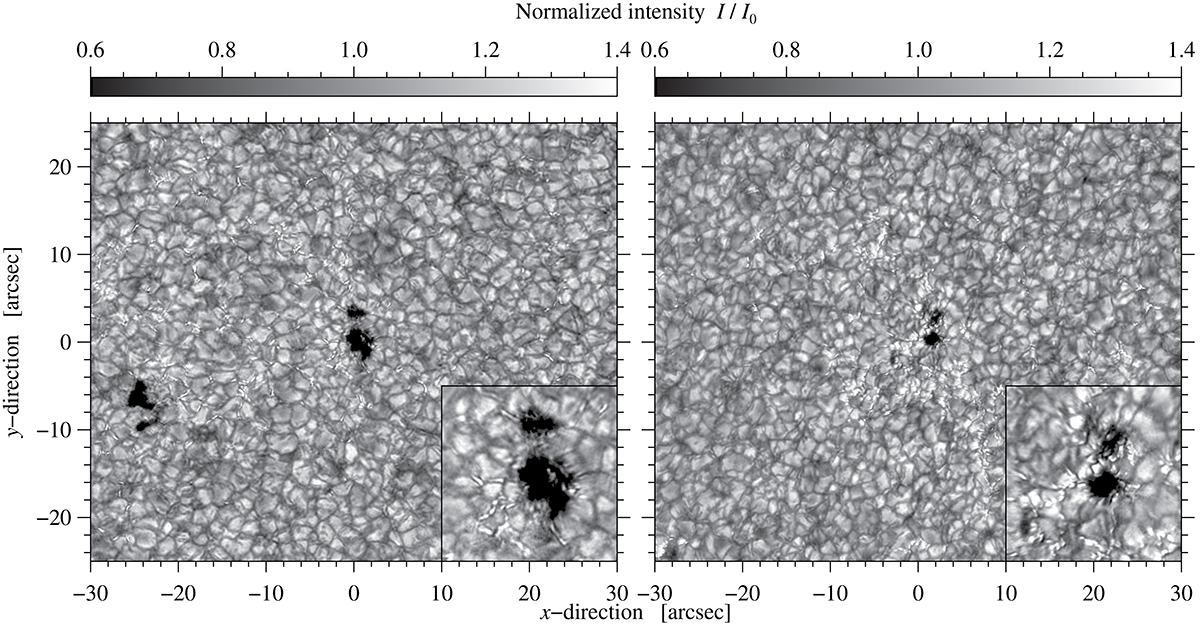
Fig. 2.
Download original image
Pores observed at 07:53 UT on 29 May (left) and at 07:42 UT on 6 June (right) as seen in the best HiFI speckle-restored G-band images. A zoom-in with a FOV of 10″ × 10″ on the central pore is displayed in the lower right corners on both days. The images were normalized such that the mean of the quiet Sun intensity corresponds to unity. Animations showing the evolution of the pores are available online.
Current usage metrics show cumulative count of Article Views (full-text article views including HTML views, PDF and ePub downloads, according to the available data) and Abstracts Views on Vision4Press platform.
Data correspond to usage on the plateform after 2015. The current usage metrics is available 48-96 hours after online publication and is updated daily on week days.
Initial download of the metrics may take a while.