Fig. 13.
Download original image
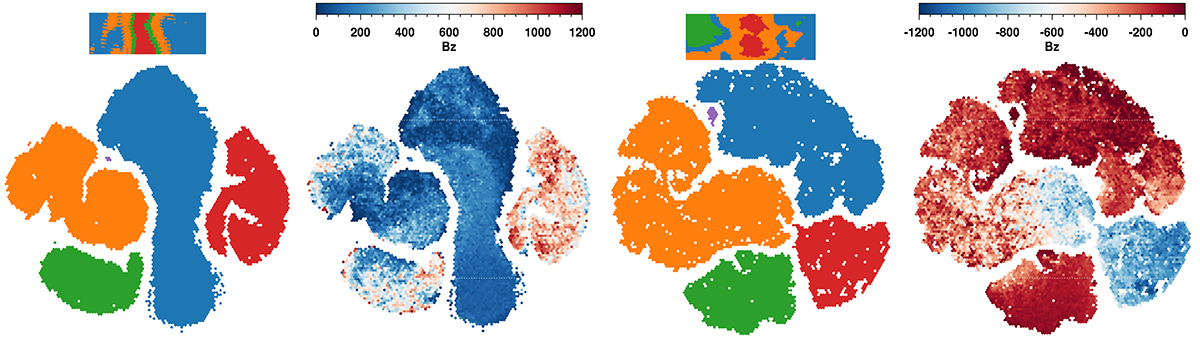
Two-dimensional t-SNE projections based on Stokes-V profiles observed on 29 May (two left panels) and on 6 June (two right panels). The five clusters identified in the t-SNE projections for both days are color-coded. The vertical magnetic field strength (second and fourth panels) is used to color the projections providing a visual guide to interpret the t-SNE projections. The back projections highlighting the onion-peel structure for both pores are shown at the top of the color-coded t-SNE projection.
Current usage metrics show cumulative count of Article Views (full-text article views including HTML views, PDF and ePub downloads, according to the available data) and Abstracts Views on Vision4Press platform.
Data correspond to usage on the plateform after 2015. The current usage metrics is available 48-96 hours after online publication and is updated daily on week days.
Initial download of the metrics may take a while.