Fig. 9
Download original image
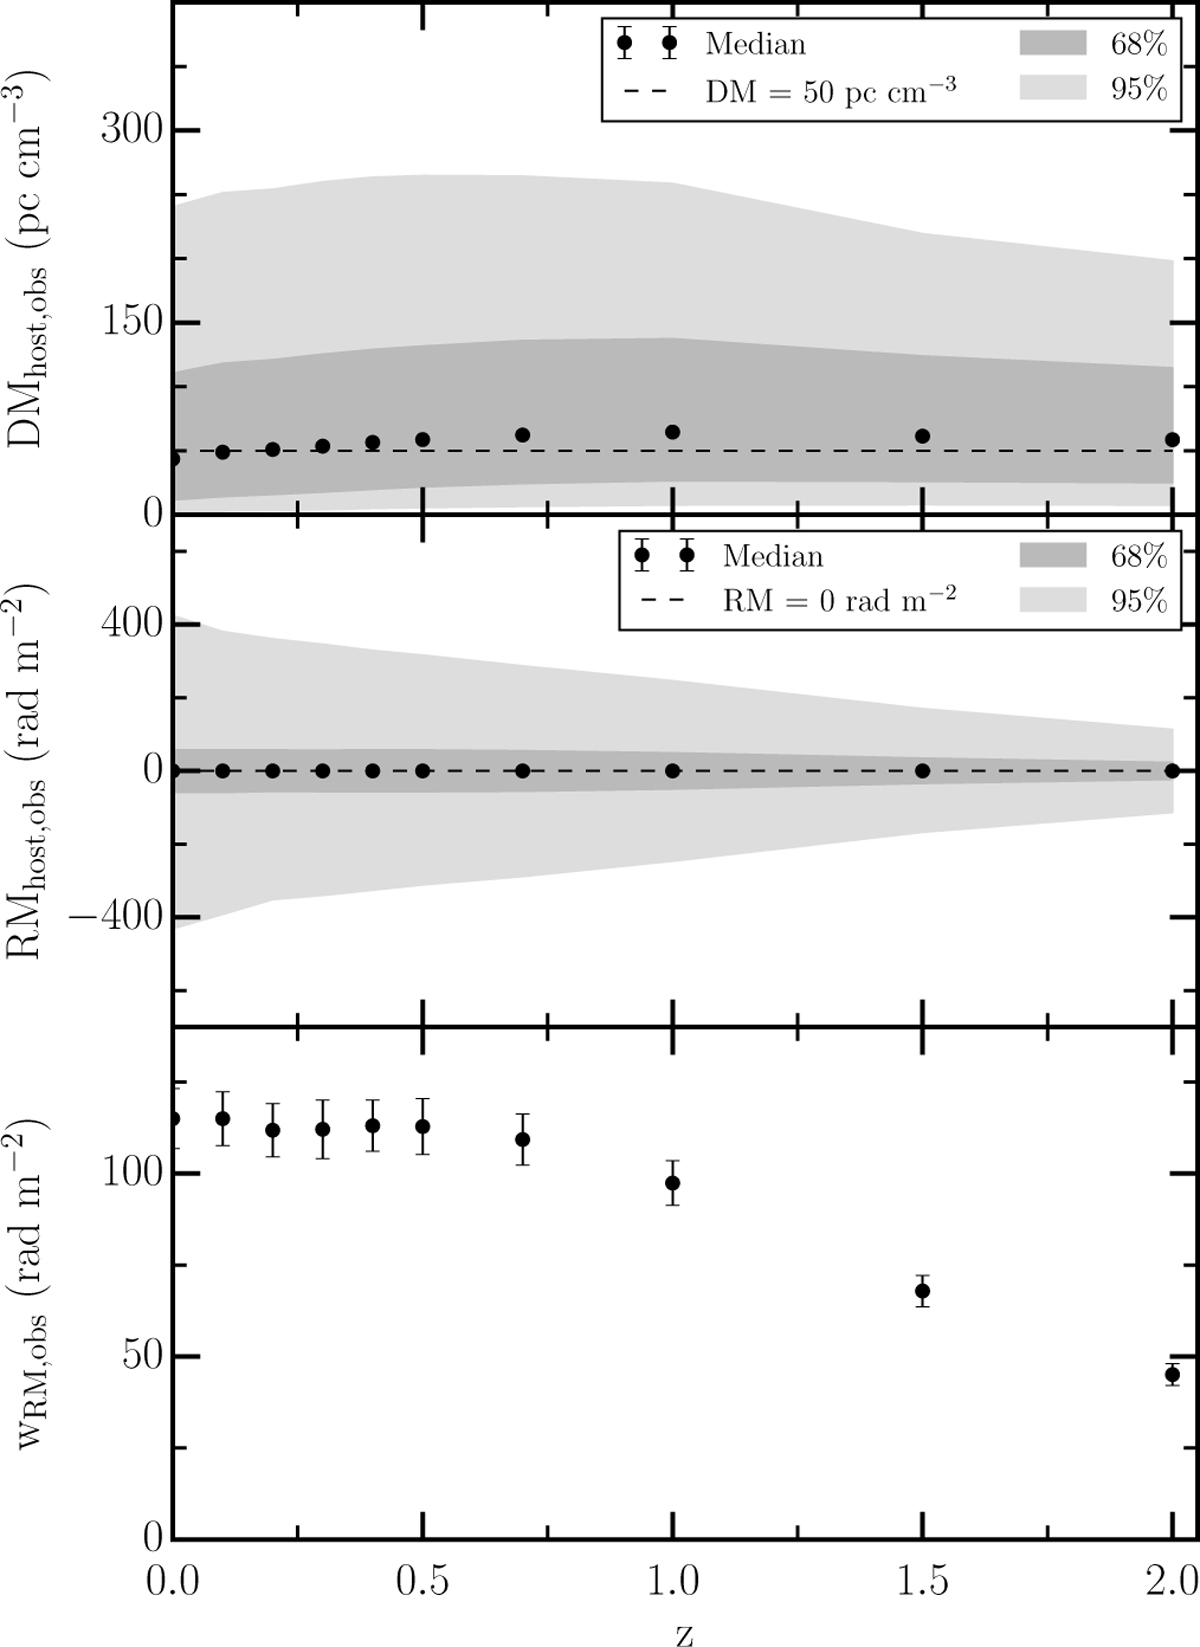
Same as Fig. 4, but in the observer’s frame. Top: possible observed DM contribution of host galaxies based on 68% and 95% of our sightlines. The black points are the medians of DM at each redshift. Middle: same as top, but for the possible observed RM contribution of host galaxies. Bottom: width of the observed RM distribution as a function of redshift.
Current usage metrics show cumulative count of Article Views (full-text article views including HTML views, PDF and ePub downloads, according to the available data) and Abstracts Views on Vision4Press platform.
Data correspond to usage on the plateform after 2015. The current usage metrics is available 48-96 hours after online publication and is updated daily on week days.
Initial download of the metrics may take a while.