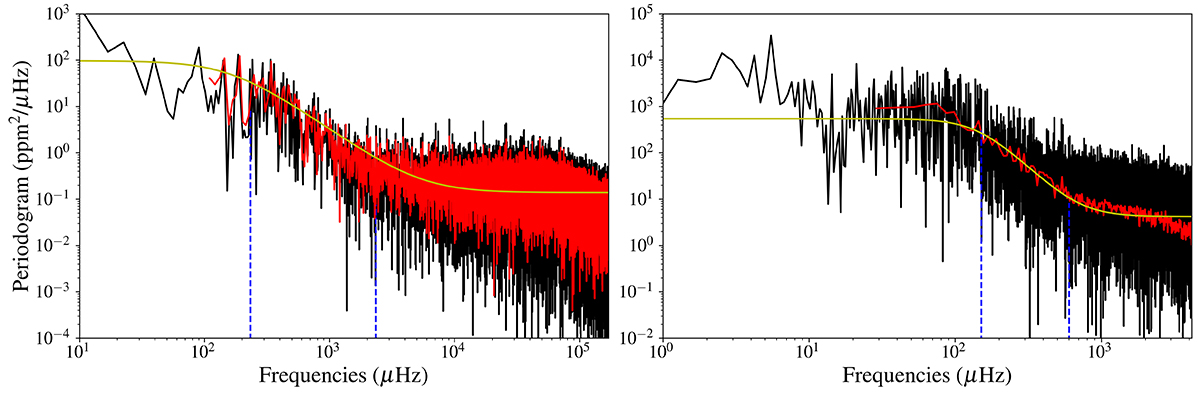
Fig. 7.
Download original image
Periodograms of CHEOPS and TESS lightcurves. Left: Periodogram of the first CHEOPS visit prewhitened by the significant oscillations (black), and averaged periodogram combining two one-day subseries (red). Right: Periodogram of TESS sector 29 prewhitened by the significant oscillations (black), and averaged periodogram combining the 25 available one-day subseries (red). In both panels, best-fitting models resulting from Harvey function fits given by Eq. (4) are shown in yellow. The cut-off frequencies of the flicker noise resulting from the MCMC analyses are indicated by the blue vertical dashed lines. We note the different frequency ranges on the x-axes.
Current usage metrics show cumulative count of Article Views (full-text article views including HTML views, PDF and ePub downloads, according to the available data) and Abstracts Views on Vision4Press platform.
Data correspond to usage on the plateform after 2015. The current usage metrics is available 48-96 hours after online publication and is updated daily on week days.
Initial download of the metrics may take a while.