Fig. 4.
Download original image
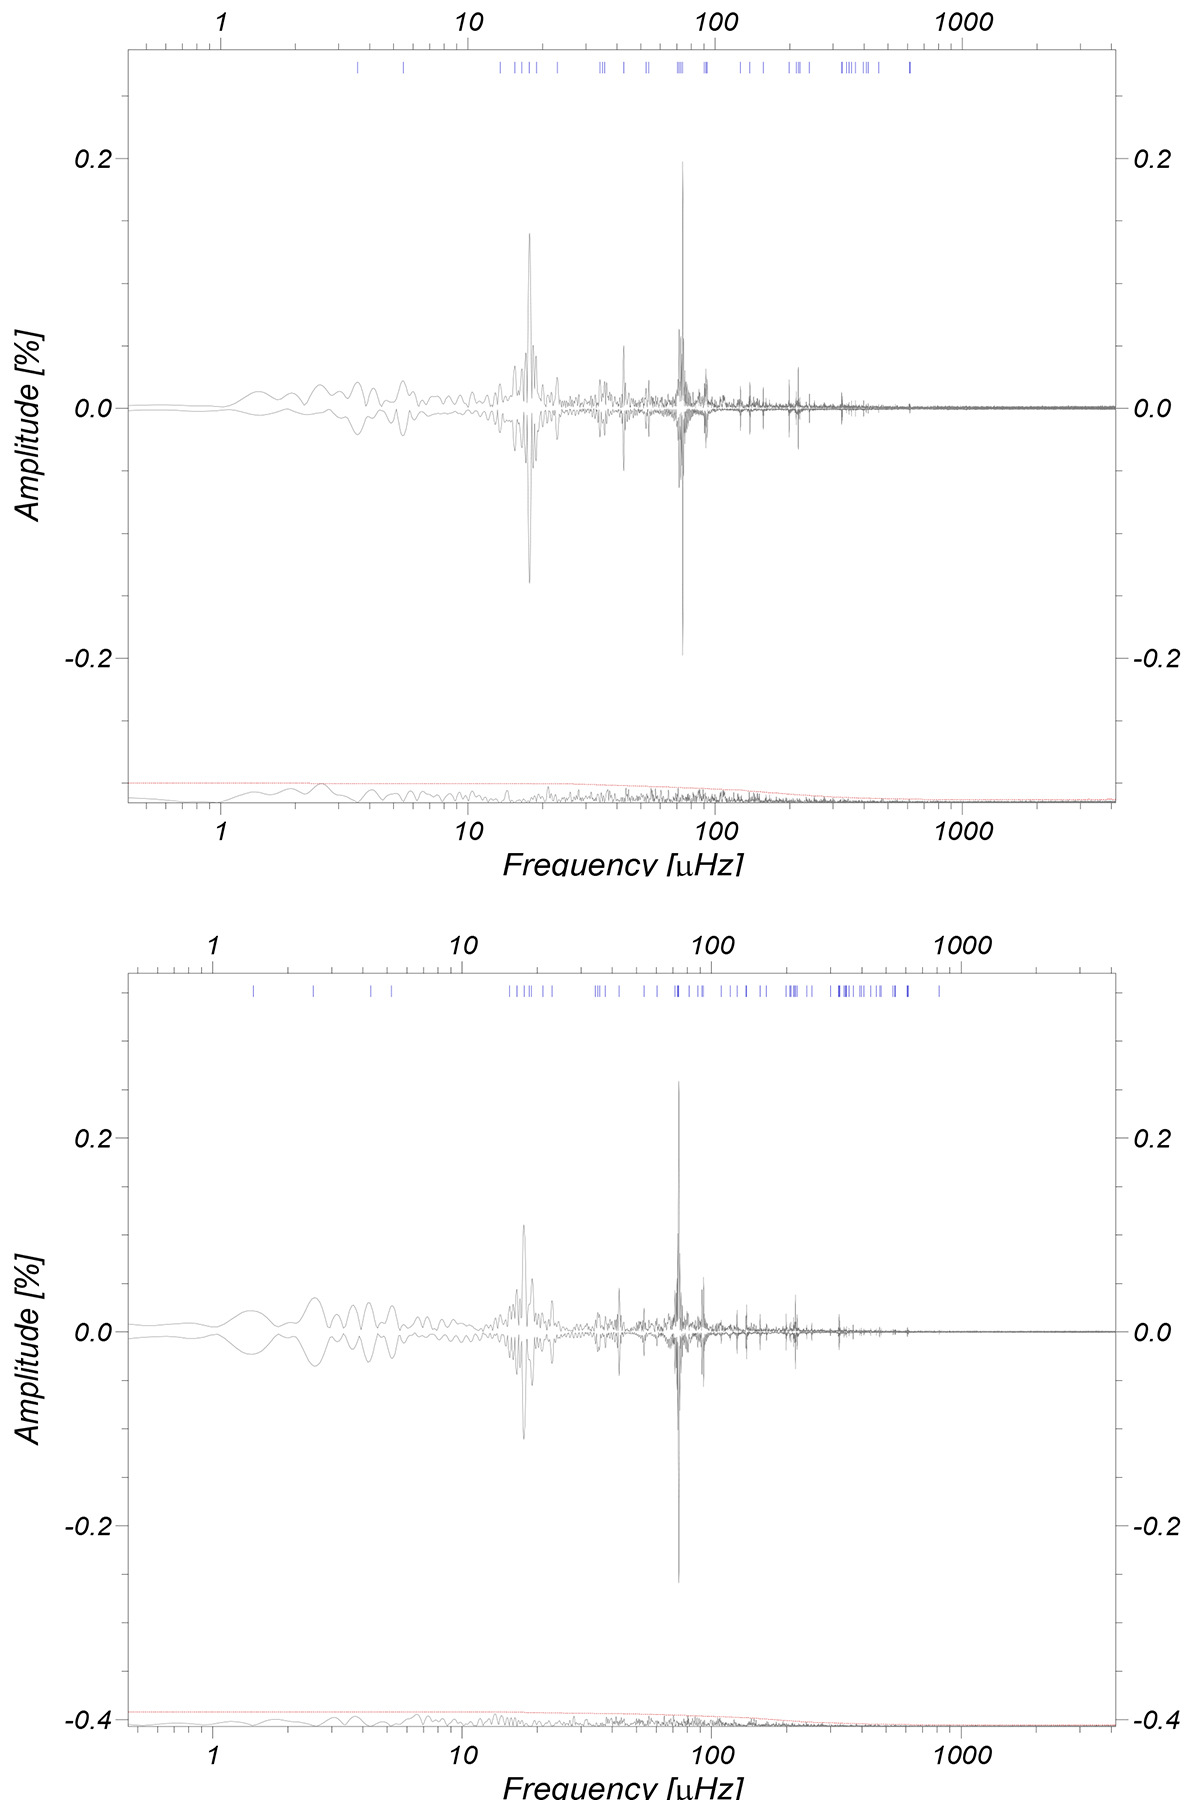
LSP of TESS lighcurves. Top: LSP of the TESS S2 lightcurve. Bottom: same as the top panel but for S29. The red dashed line indicates the S/N = 5.0 threshold. The top curve shows the LSP computed from the corresponding TESS light curve. Each small vertical blue segment indicates a frequency extracted during the prewhitening. The frequencies and their properties are listed in Tables A.1 and A.2. The curve plotted upside down is a reconstruction of the LSP based on the data summarised in this table, and the curve at the bottom (shifted vertically by an arbitrary amount for visibility) is the residual containing only noise after removing all the signal from the light curve.
Current usage metrics show cumulative count of Article Views (full-text article views including HTML views, PDF and ePub downloads, according to the available data) and Abstracts Views on Vision4Press platform.
Data correspond to usage on the plateform after 2015. The current usage metrics is available 48-96 hours after online publication and is updated daily on week days.
Initial download of the metrics may take a while.