Fig. 3.
Download original image
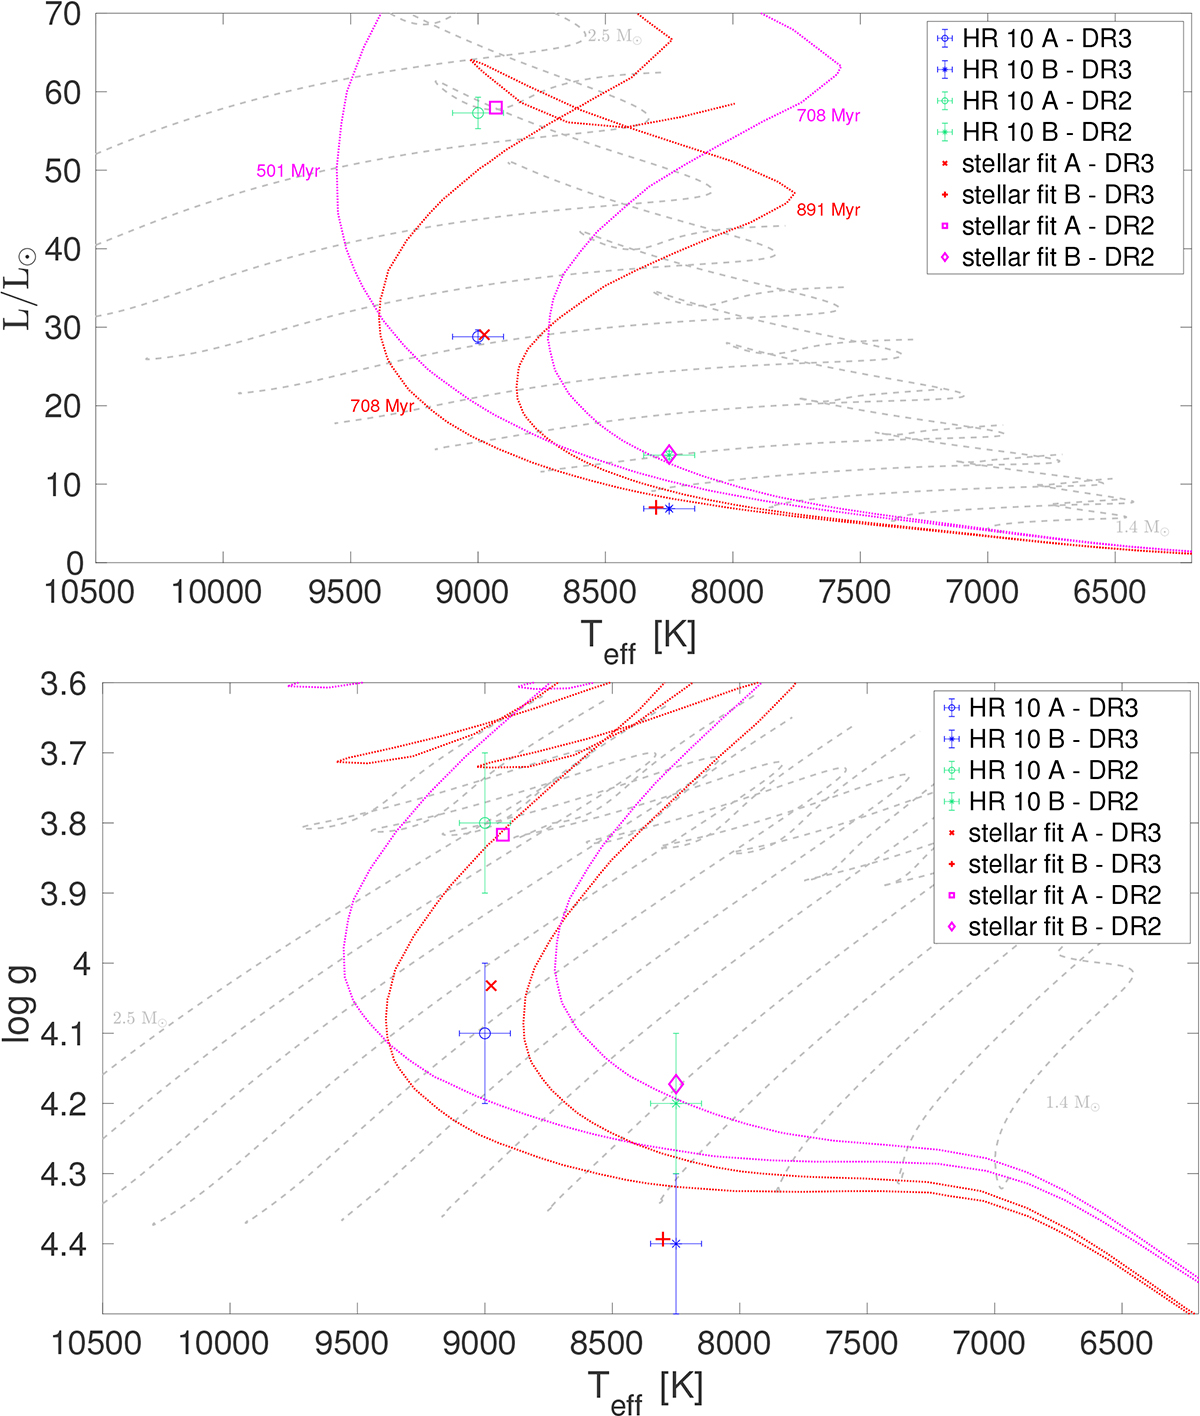
HR diagram positions of the HR 10 system. Top: stellar evolutionary tracks (grey dashed lines) as a function of Teff and L for models from 1.4 to 2.5 M⊙ (by step of 0.1 M⊙). The models are computed with solar initial metallicity and overshooting of αov = 0.05 or 0.10, depending on the mass. The symbols denote the location of HR 10 A and B, respectively, according to M19 (Gaia DR2 parallax for the luminosity, see text) in green, and with the values of L that we revised with the DR3 parallax in blue. The red and purple symbols represent the locations following the stellar parameters of HR 10 A and B modelled as single stars with the CLES code, as reported in Table 3. Isochrones computed with PARSEC1 v1.2S are also depicted, with their ages indicated in the figure. The isochrones in red were computed with the same initial metallicity as the best-fit models obtained in the DR3 case, and selecting two ages enclosing those of the best-fit models. The purple isochrones were obtained with initial metallicities corresponding to that of the best-fit models in the DR2 case. Bottom: same as top panel, but as a function of Teff and log g.
Current usage metrics show cumulative count of Article Views (full-text article views including HTML views, PDF and ePub downloads, according to the available data) and Abstracts Views on Vision4Press platform.
Data correspond to usage on the plateform after 2015. The current usage metrics is available 48-96 hours after online publication and is updated daily on week days.
Initial download of the metrics may take a while.