Open Access
Fig. 13.
Download original image
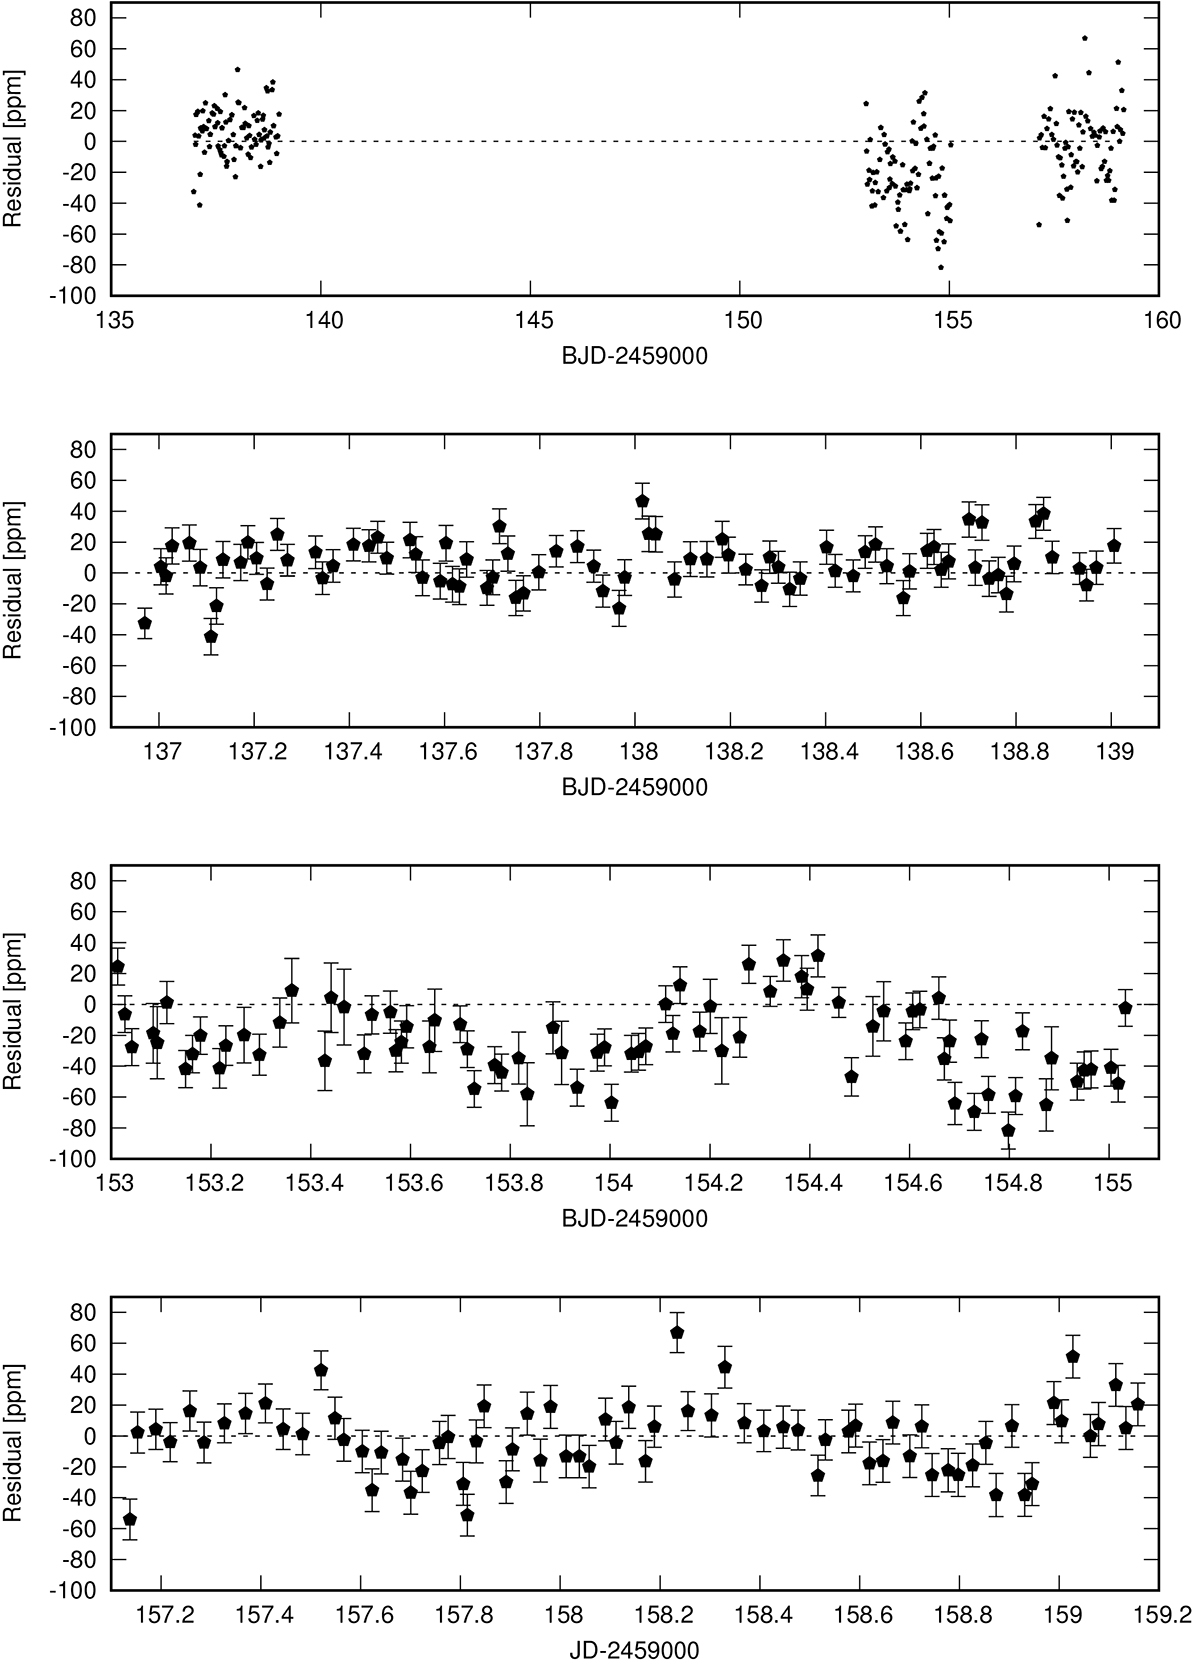
Step-by-step analysis of the CHEOPS data processed with PIPE and removing the frequencies identified in the CHEOPS data one by one. The top panel depicts the three CHEOPS visits together, while the three bottom panels each represent the isolated visits.
Current usage metrics show cumulative count of Article Views (full-text article views including HTML views, PDF and ePub downloads, according to the available data) and Abstracts Views on Vision4Press platform.
Data correspond to usage on the plateform after 2015. The current usage metrics is available 48-96 hours after online publication and is updated daily on week days.
Initial download of the metrics may take a while.