Open Access
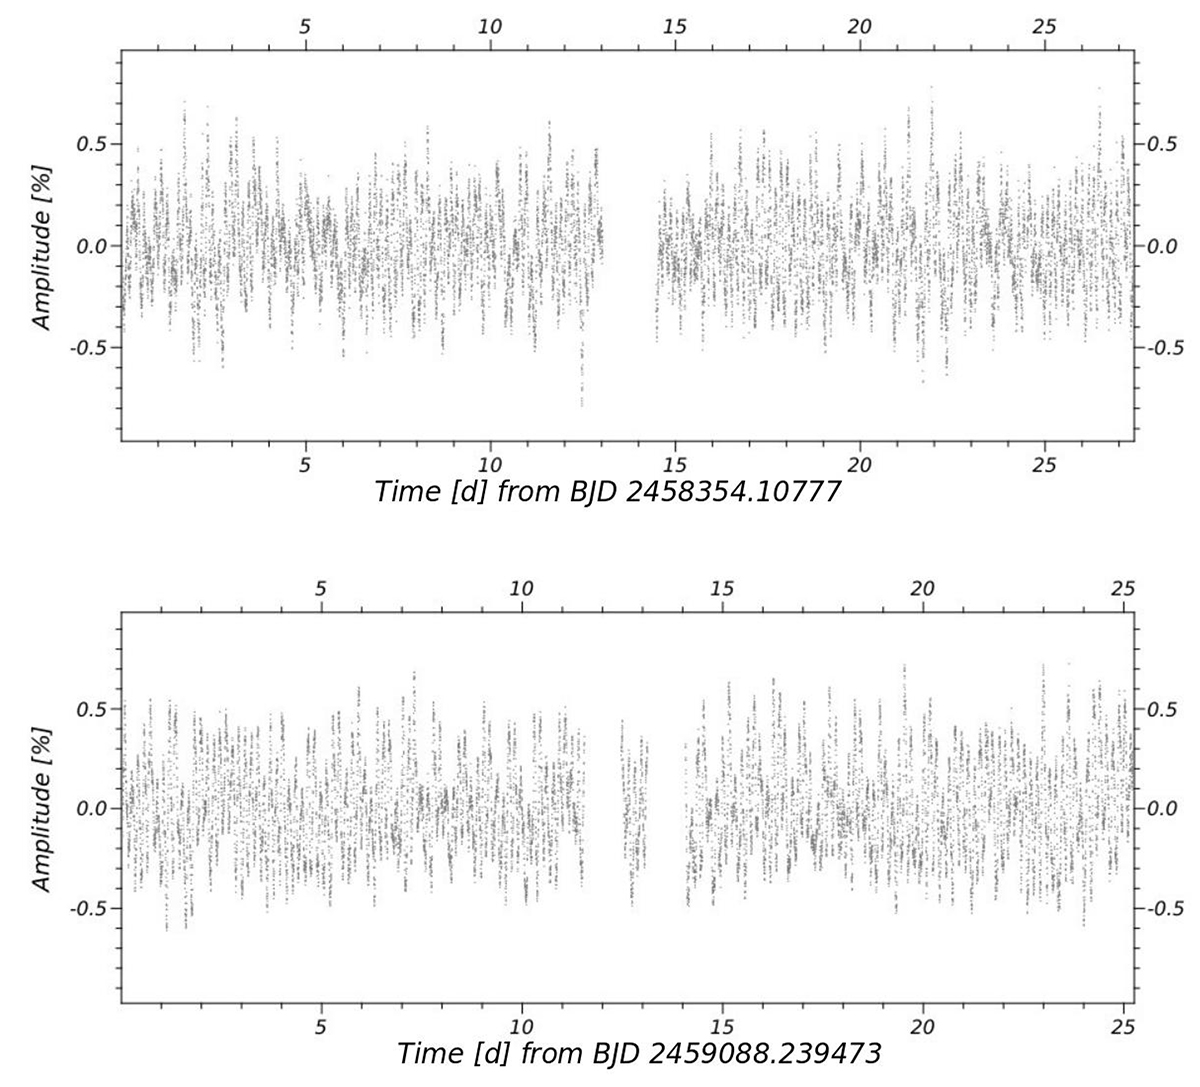
Fig. 1.
Download original image
Reduced TESS lighcurves. Top: lightcurve from S2 processed following the recipe of Nardiello et al. (2020, 2021) on the SAP lightcurve (see text). Bottom: same as the top panel but for S29. The typical error on the relative flux is 10−6%, for a maximum variation of ∼0.8% of the mean brightness of the star.
Current usage metrics show cumulative count of Article Views (full-text article views including HTML views, PDF and ePub downloads, according to the available data) and Abstracts Views on Vision4Press platform.
Data correspond to usage on the plateform after 2015. The current usage metrics is available 48-96 hours after online publication and is updated daily on week days.
Initial download of the metrics may take a while.