Fig. 7
Download original image
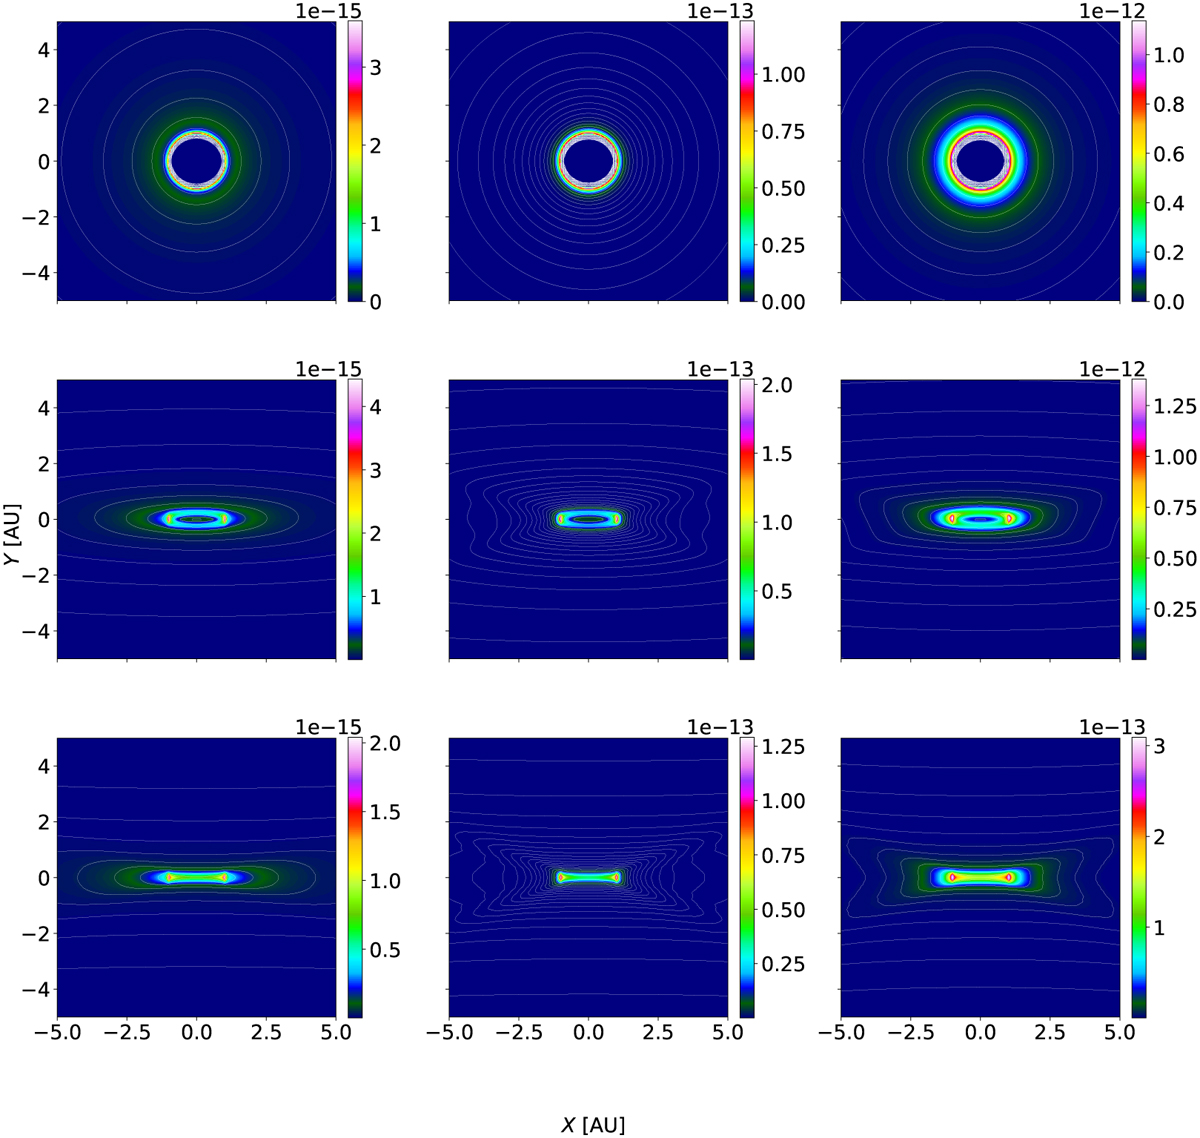
Images at λ = 2.3, 4.5, and 12.1 μm (left, middle, and right panels, respectively) of the 10 AU inner regions of the axis-symmetric envelope (Sect. 5.2) and computed from the DGFEM solution with the ray-tracing module (Appendix C). The top, middle and bottom panels correspond to the inclinations i = 12.5, 77.5, and 90 deg, respectively. The colour code shows the specific intensity value (in W m−2 Hz−1 sr−1) of the envelope ![]() , inside each pixel. The solid white lines show the iso-contours of
, inside each pixel. The solid white lines show the iso-contours of ![]() .
.
Current usage metrics show cumulative count of Article Views (full-text article views including HTML views, PDF and ePub downloads, according to the available data) and Abstracts Views on Vision4Press platform.
Data correspond to usage on the plateform after 2015. The current usage metrics is available 48-96 hours after online publication and is updated daily on week days.
Initial download of the metrics may take a while.