Fig. 4
Download original image
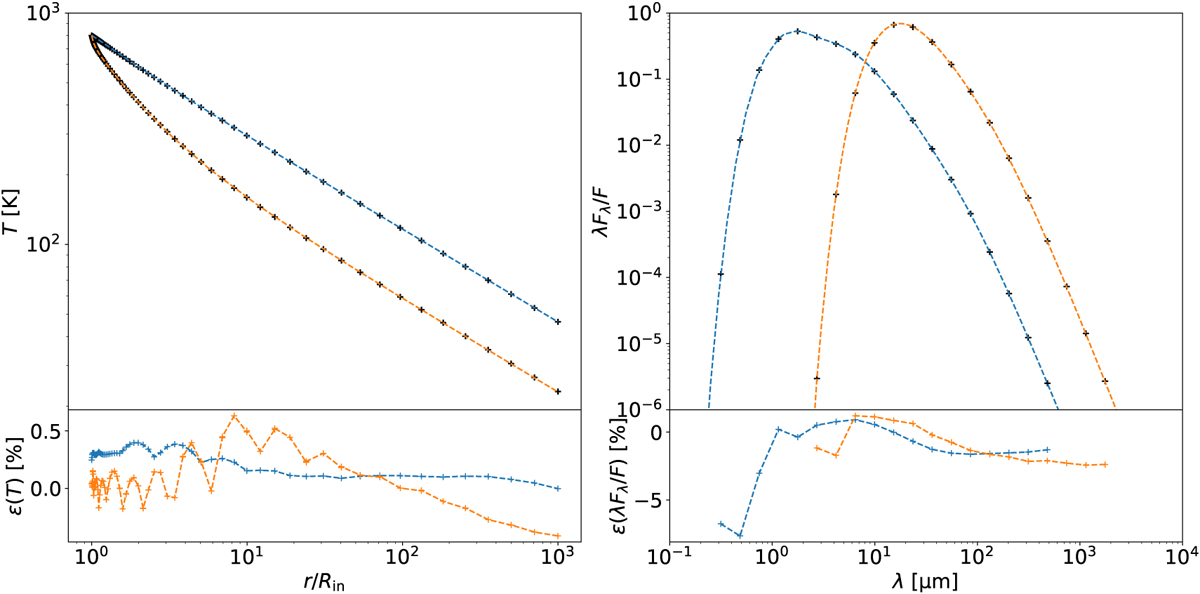
Temperature profiles (left panels) and normalised SEDs (right panels) for the spherically symmetric envelope, with ![]() (blue curve) and
(blue curve) and ![]() (orange curve). The cross marks represent the solution from this study and the dashed curves are from DUSTY (Ivezic et al. 1997). The lower panels show the relative differences between the two codes.
(orange curve). The cross marks represent the solution from this study and the dashed curves are from DUSTY (Ivezic et al. 1997). The lower panels show the relative differences between the two codes.
Current usage metrics show cumulative count of Article Views (full-text article views including HTML views, PDF and ePub downloads, according to the available data) and Abstracts Views on Vision4Press platform.
Data correspond to usage on the plateform after 2015. The current usage metrics is available 48-96 hours after online publication and is updated daily on week days.
Initial download of the metrics may take a while.