Fig. C.1
Download original image
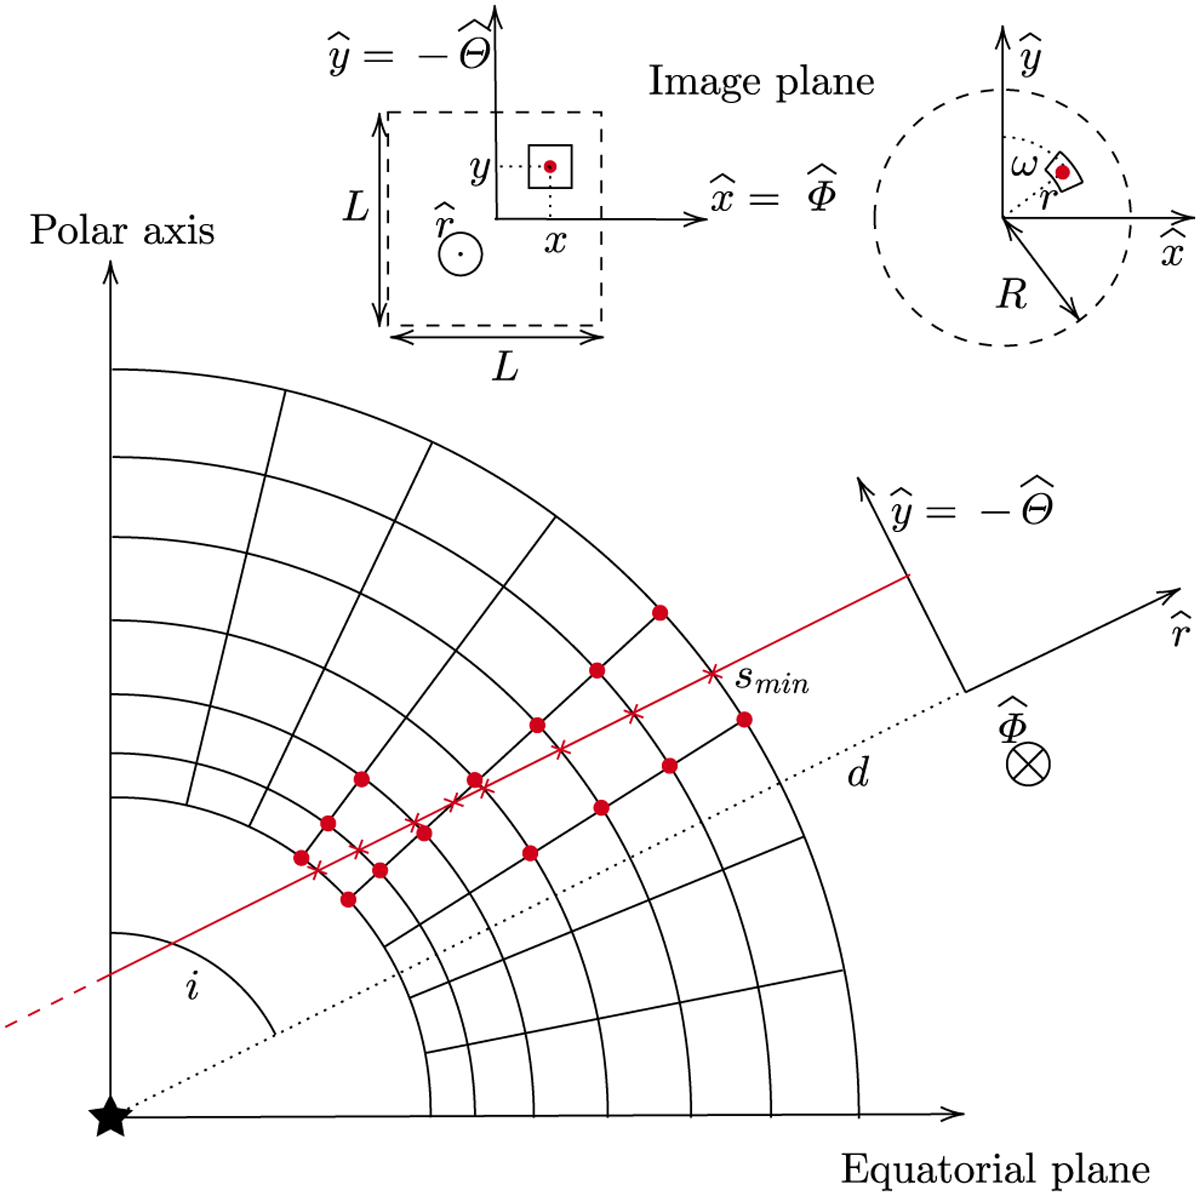
Example of a ray (red line) normal to the image plane, crossing the spherical grid. In this example, we display a square image of size L × L and a circular image of radius R. The red crosses represent the intersections between the ray and the grid. The values of ![]() and Sv at these intersections are linearly interpolated from the grid adjacent values (red dots).
and Sv at these intersections are linearly interpolated from the grid adjacent values (red dots).
Current usage metrics show cumulative count of Article Views (full-text article views including HTML views, PDF and ePub downloads, according to the available data) and Abstracts Views on Vision4Press platform.
Data correspond to usage on the plateform after 2015. The current usage metrics is available 48-96 hours after online publication and is updated daily on week days.
Initial download of the metrics may take a while.