Fig. 10
Download original image
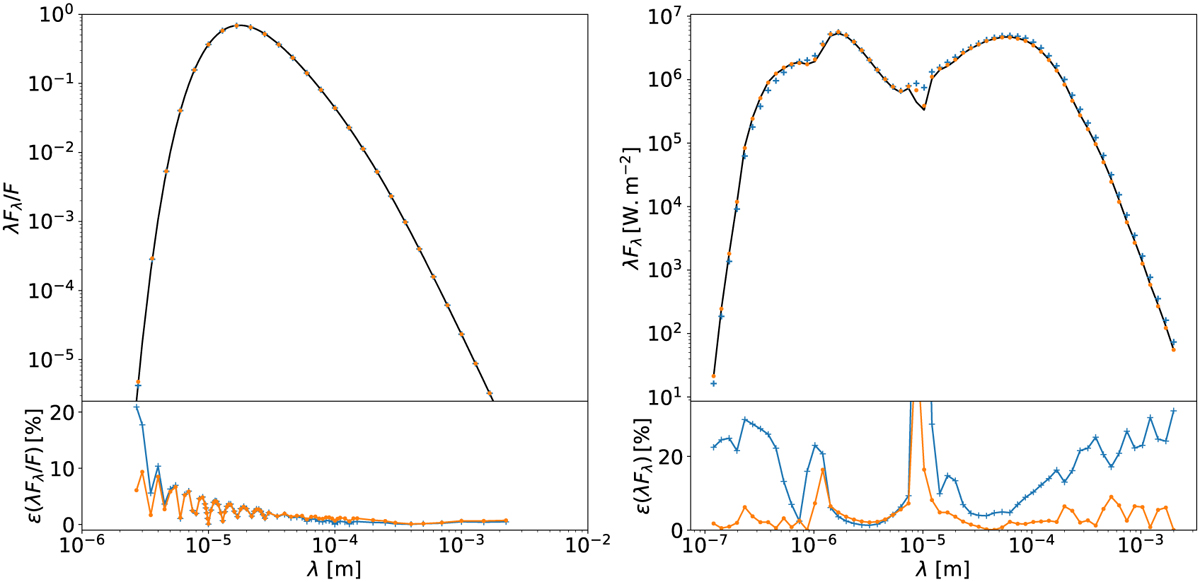
Emerging SEDs of RADMC-3D (solid black lines) and of the DGFEM code, computed from the post-processing ray-tracing procedure (orange dots), and from the DGFEM solution at the outer edge (blue crosses). The left panel corresponds to the optically thick spherically symmetric case (τ = 100, see Sect. 5.1) while the right panel corresponds to the optically thick disc benchmark from Sect. 5.2. The lower panels show the relative difference between the curves of this study and the benchmarks.
Current usage metrics show cumulative count of Article Views (full-text article views including HTML views, PDF and ePub downloads, according to the available data) and Abstracts Views on Vision4Press platform.
Data correspond to usage on the plateform after 2015. The current usage metrics is available 48-96 hours after online publication and is updated daily on week days.
Initial download of the metrics may take a while.