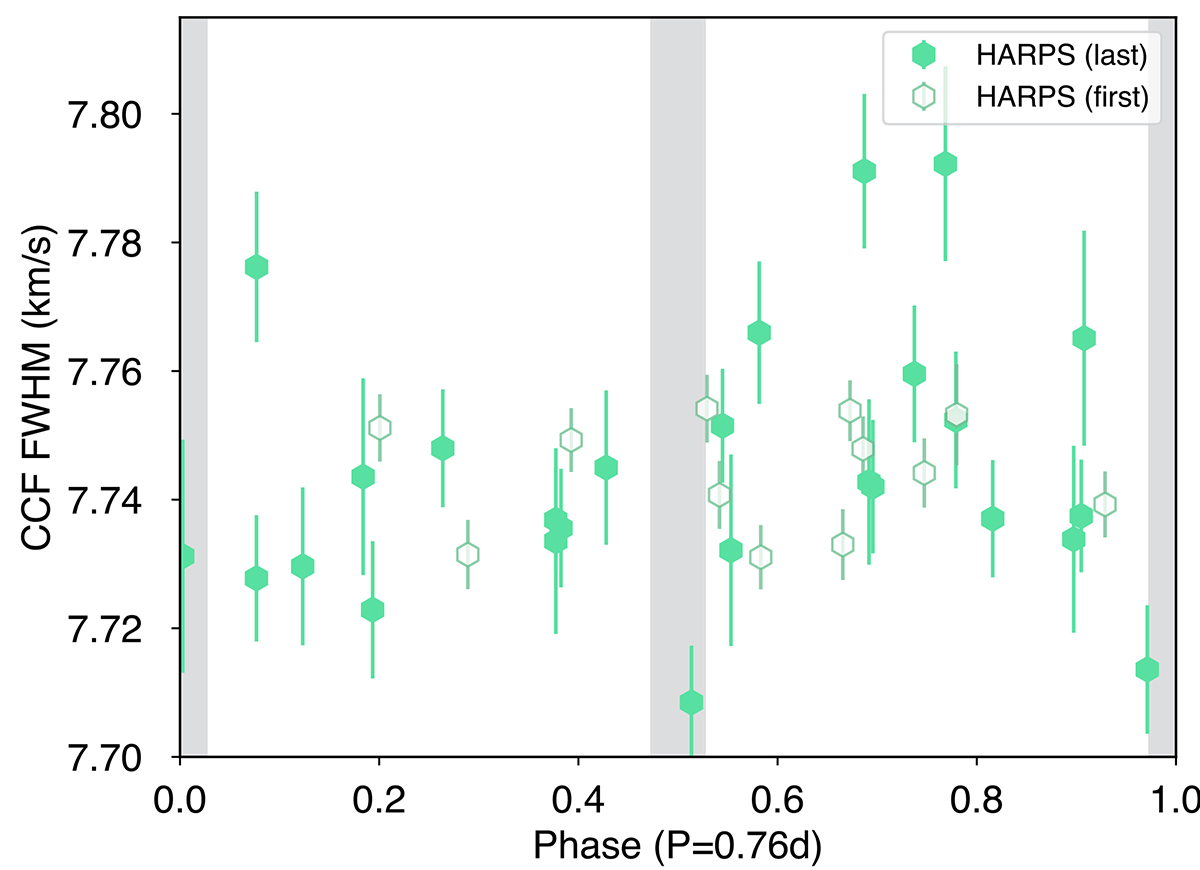
Fig. A.5.
Download original image
Full-width at half-maximum (FWHM) of the cross-correlation function from the HARPS dataset phase folded with a 0.76-day period. Open symbols represent HARPS data obtained in the first campaign (in 2018), while filled symbols represent data from the last campaign (in 2023). The gray shaded regions show the location of the primary and secondary eclipses assuming a circular orbit for the binary.
Current usage metrics show cumulative count of Article Views (full-text article views including HTML views, PDF and ePub downloads, according to the available data) and Abstracts Views on Vision4Press platform.
Data correspond to usage on the plateform after 2015. The current usage metrics is available 48-96 hours after online publication and is updated daily on week days.
Initial download of the metrics may take a while.