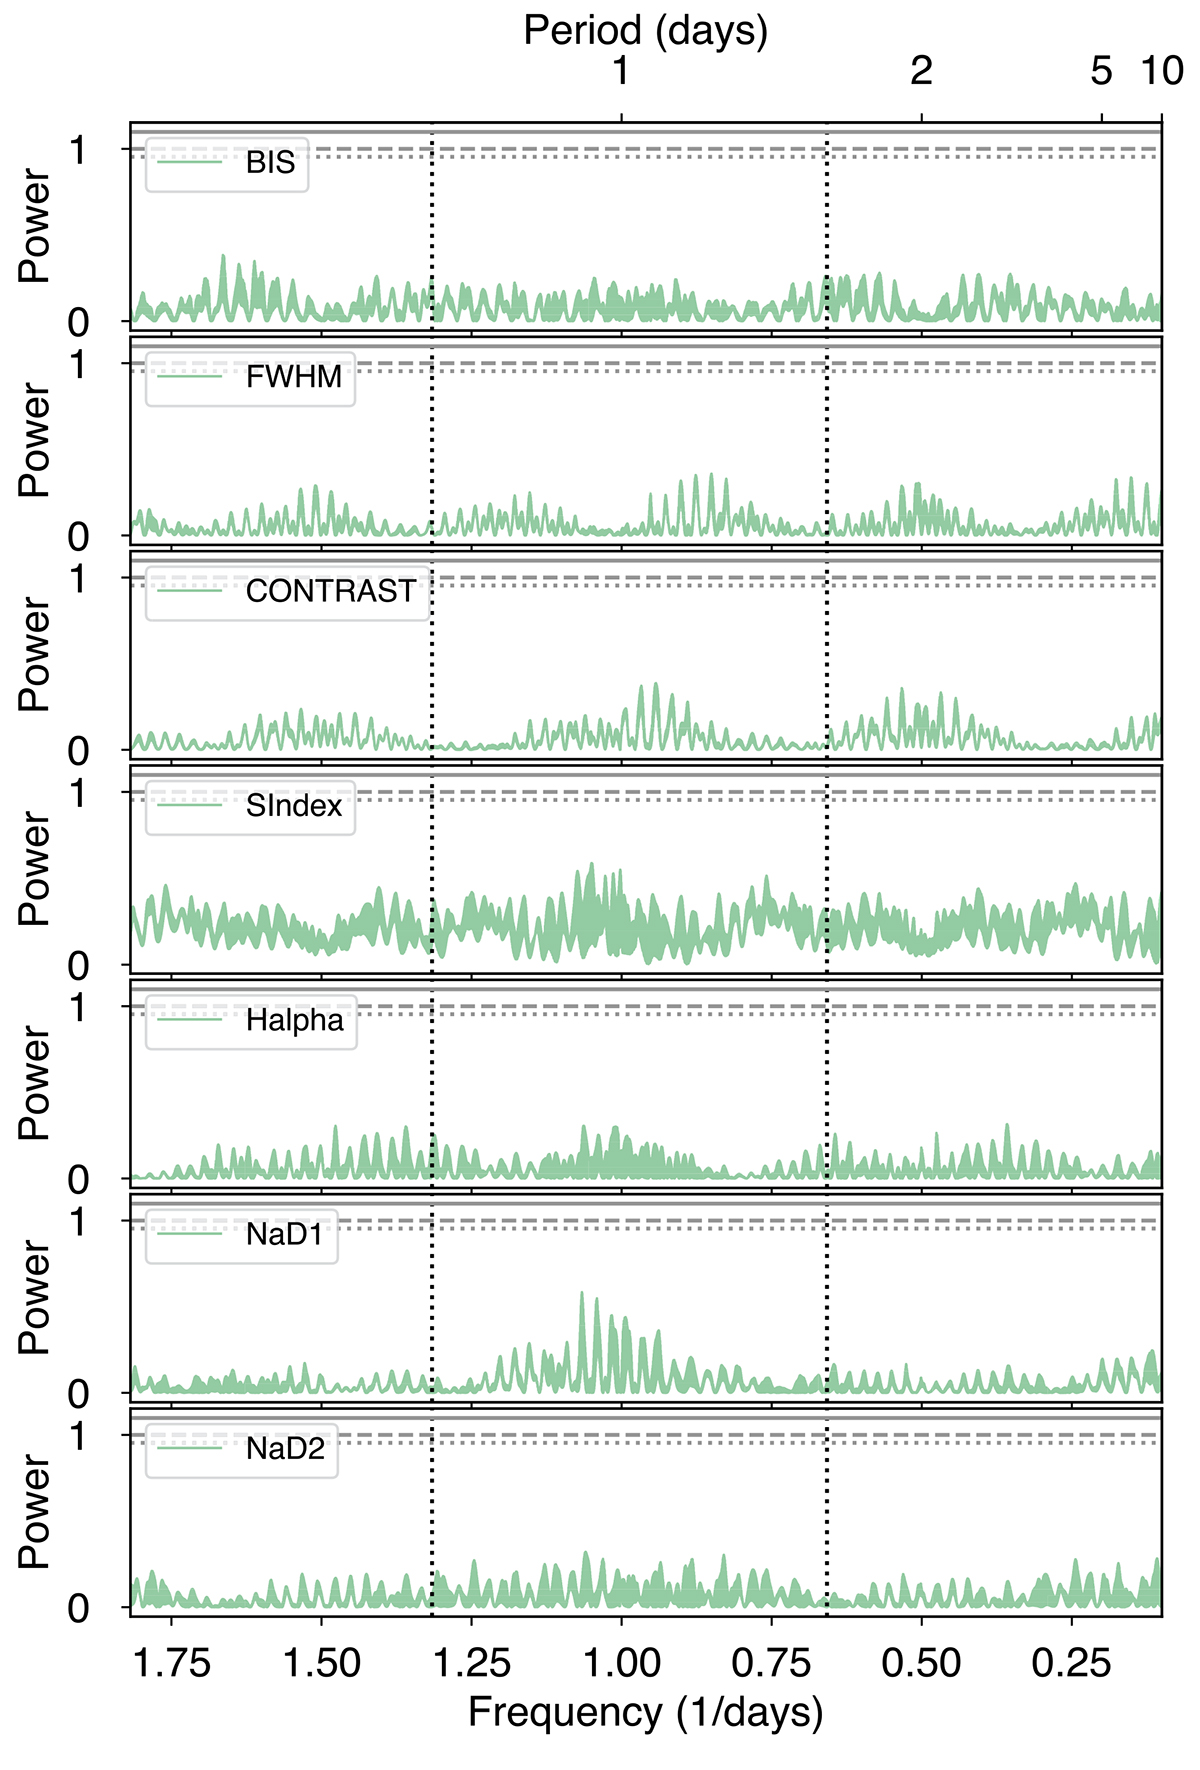
Fig. A.4.
Download original image
Generalized Lomb-Scargle (GLS) periodogram of the activity indicators from the HARPS observations as determined from the HARPS-TERRA pipeline. The vertical dotted lines indicate the 0.76 days and twice this period (1.52 days). False alarm probabilities of 1%, 5%, and 10% are indicated with horizontal dotted, dashed and solid lines, respectively.
Current usage metrics show cumulative count of Article Views (full-text article views including HTML views, PDF and ePub downloads, according to the available data) and Abstracts Views on Vision4Press platform.
Data correspond to usage on the plateform after 2015. The current usage metrics is available 48-96 hours after online publication and is updated daily on week days.
Initial download of the metrics may take a while.