Fig. A.3.
Download original image
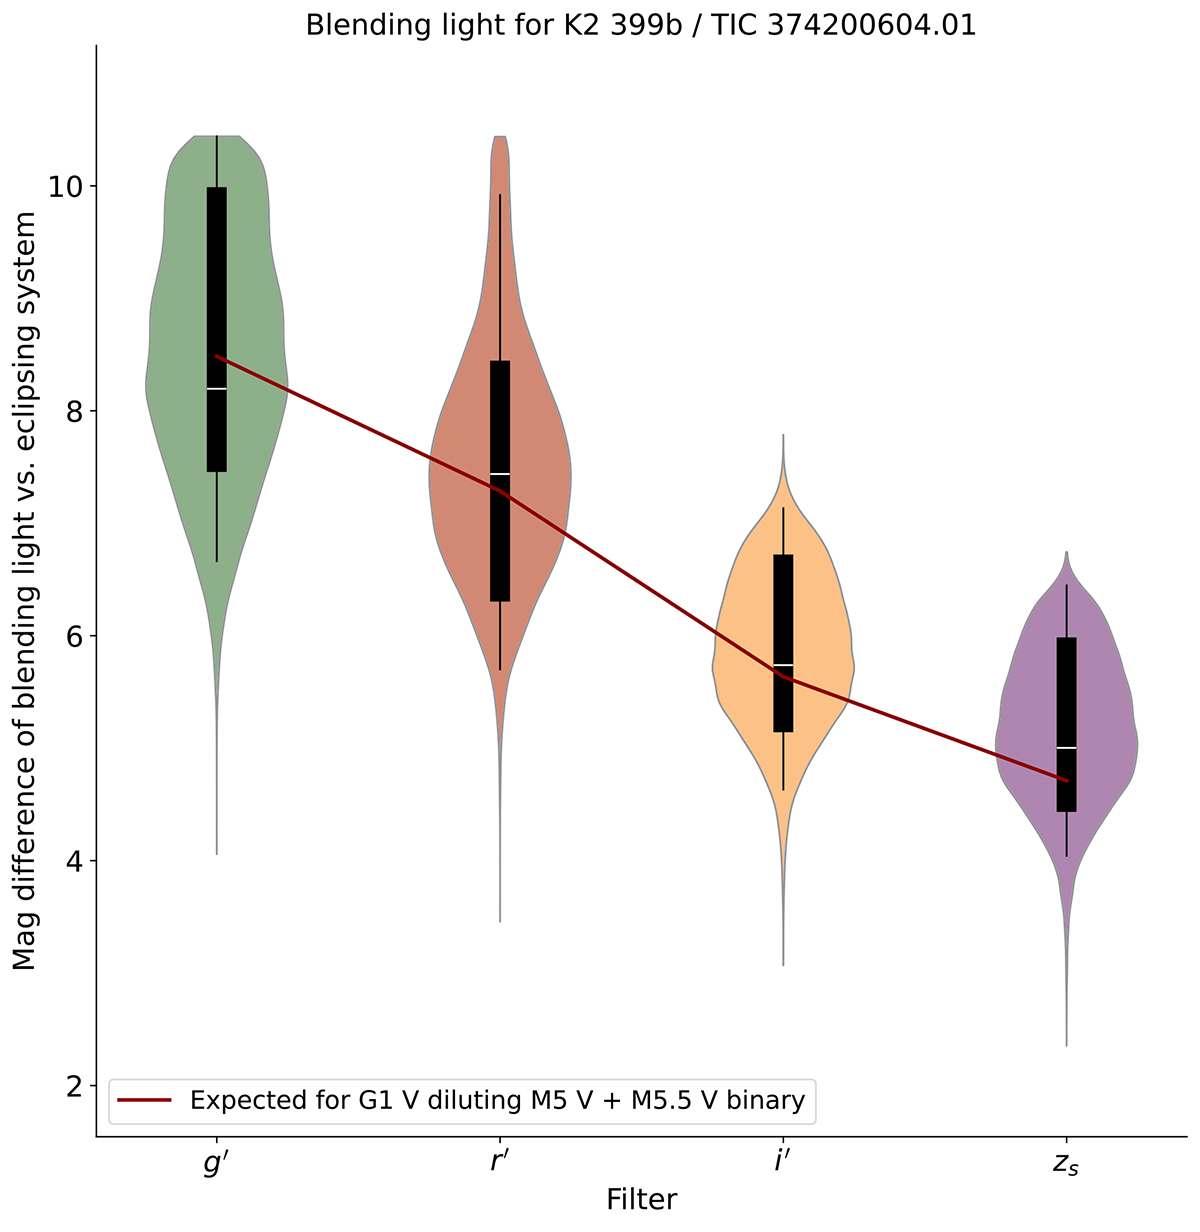
Posterior distribution of the dilution factors (flux ratios between blending light and flux of the eclipsing system) for the four bands of the MuSCAT3 observations, expressed in magnitudes. The central black box shows the 68.3% credible interval with the median marked as a white line, and the larger solid lines represent the 95.4% credible interval. The surrounding color shows the posterior distributions from the MCMC run. The solid line shows the expected flux of a G1 V star in each band compared to a pair of M5 V stars (see text for details).
Current usage metrics show cumulative count of Article Views (full-text article views including HTML views, PDF and ePub downloads, according to the available data) and Abstracts Views on Vision4Press platform.
Data correspond to usage on the plateform after 2015. The current usage metrics is available 48-96 hours after online publication and is updated daily on week days.
Initial download of the metrics may take a while.