Fig. B.2.
Download original image
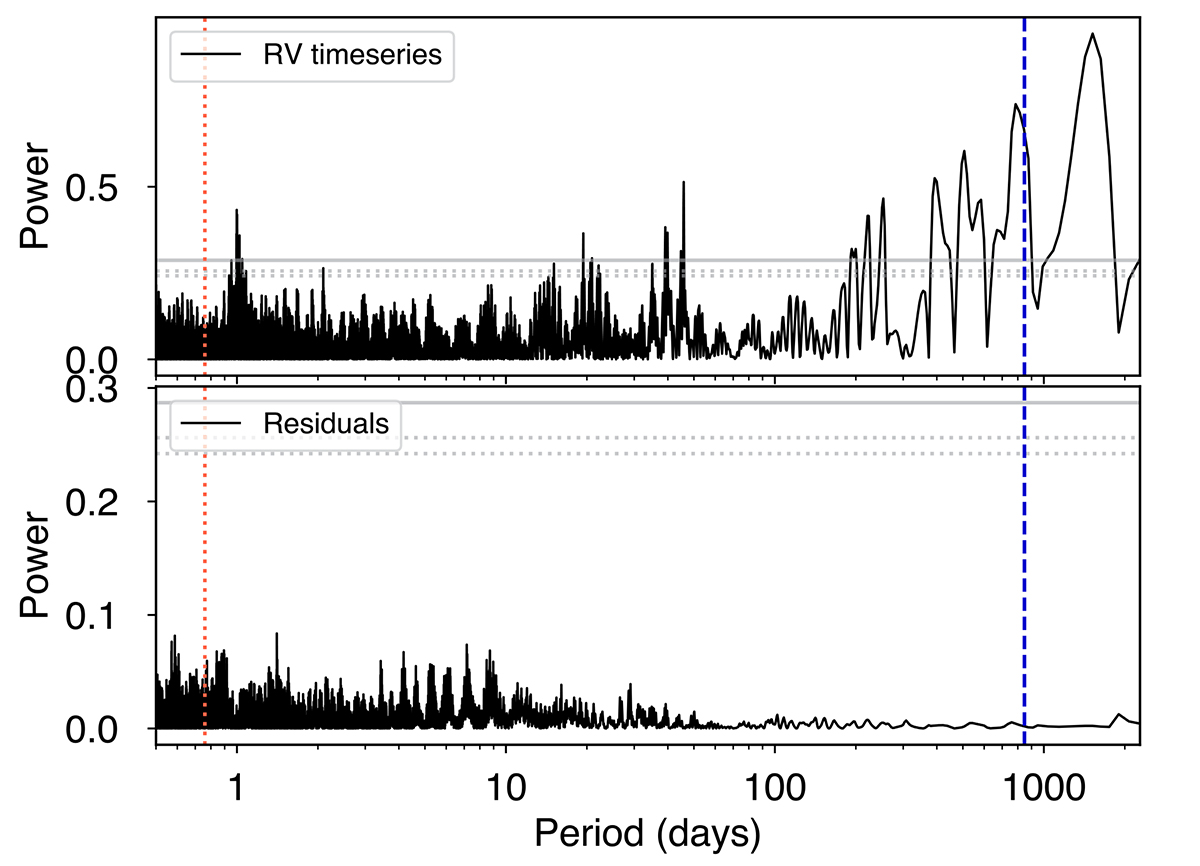
Top panel: Generalised Lomb-Scargle (GLS) periodogram of the RV time series from the TRES, HARPS and CARMENES instruments (assuming no instrumental offset). The vertical red dotted line indicates the reported transit period, while the vertical blue dashed line shows the converged periodicity of the RV data (see Sect. 3). Bottom panel: GLS of the residuals after subtracting the median RV model obtained in Sect. 3. In both panels, the horizontal dotted lines are the 1% and 5% false alarm probability (FAP) levels while the solid line corresponds to the 0.1% FAP level.
Current usage metrics show cumulative count of Article Views (full-text article views including HTML views, PDF and ePub downloads, according to the available data) and Abstracts Views on Vision4Press platform.
Data correspond to usage on the plateform after 2015. The current usage metrics is available 48-96 hours after online publication and is updated daily on week days.
Initial download of the metrics may take a while.