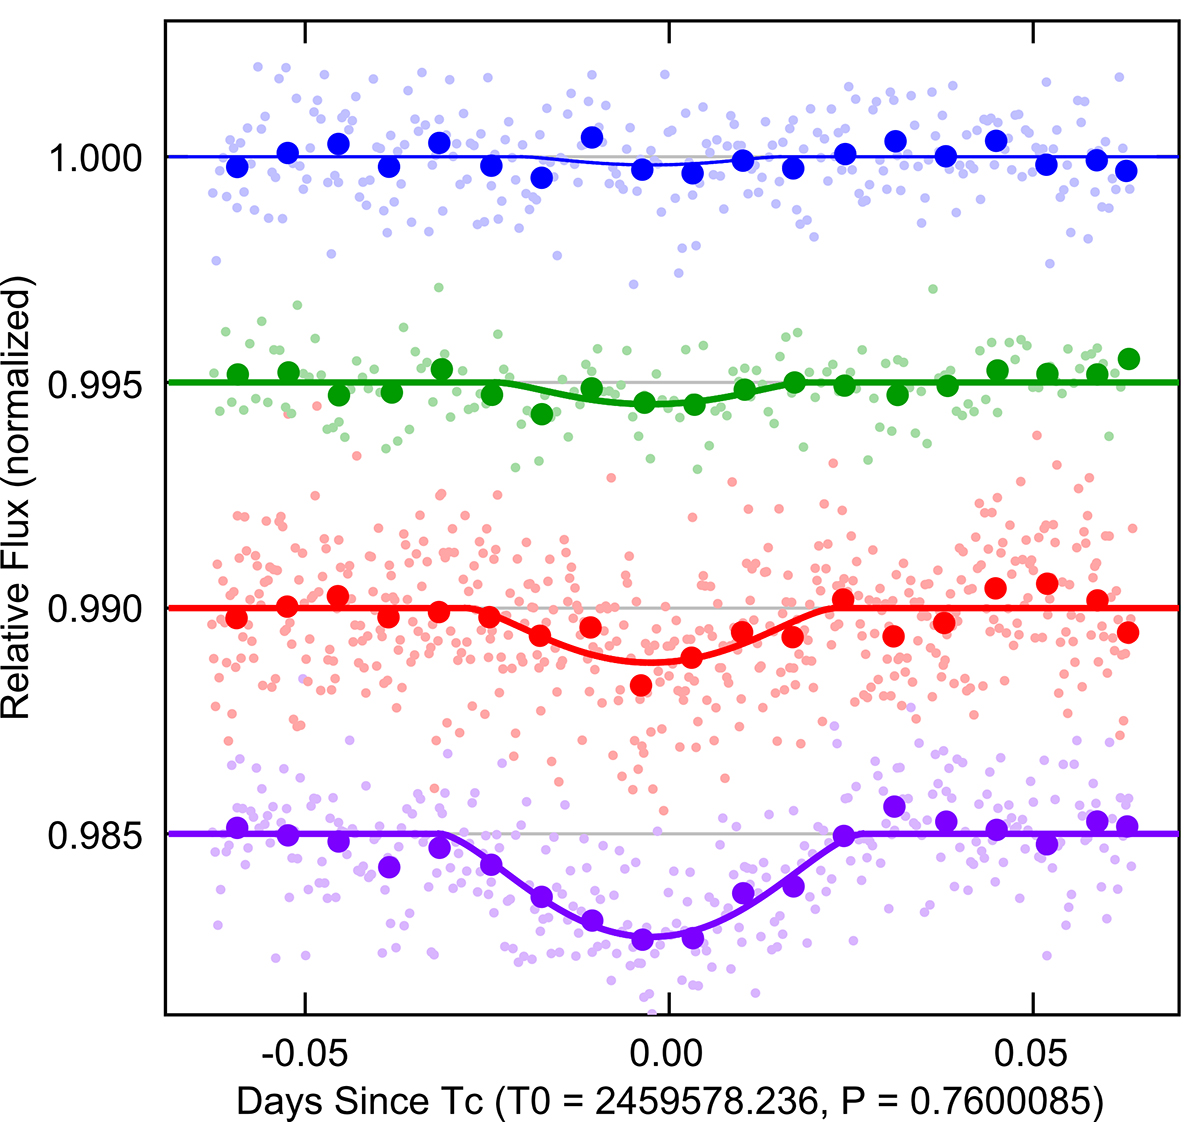
Fig. 1.
Download original image
LCOGT MuSCAT3 light curves of K2-399. The light curves from top to bottom are in the MuSCAT g, r, i, and zs bands. The small symbols show the unbinned data and the larger symbols show the same data in ten-minute bins. The transit model fits are overplotted. A V-shaped event was detected on-target with depths at mid-transit of 0.18, 0.48, 1.21, and 2.28 ppt in g, r, i, and zs bands, respectively, indicating that a fainter, much redder star is blended in the 5.1 arcsec follow-up photometric aperture and is hosting the eclipse.
Current usage metrics show cumulative count of Article Views (full-text article views including HTML views, PDF and ePub downloads, according to the available data) and Abstracts Views on Vision4Press platform.
Data correspond to usage on the plateform after 2015. The current usage metrics is available 48-96 hours after online publication and is updated daily on week days.
Initial download of the metrics may take a while.