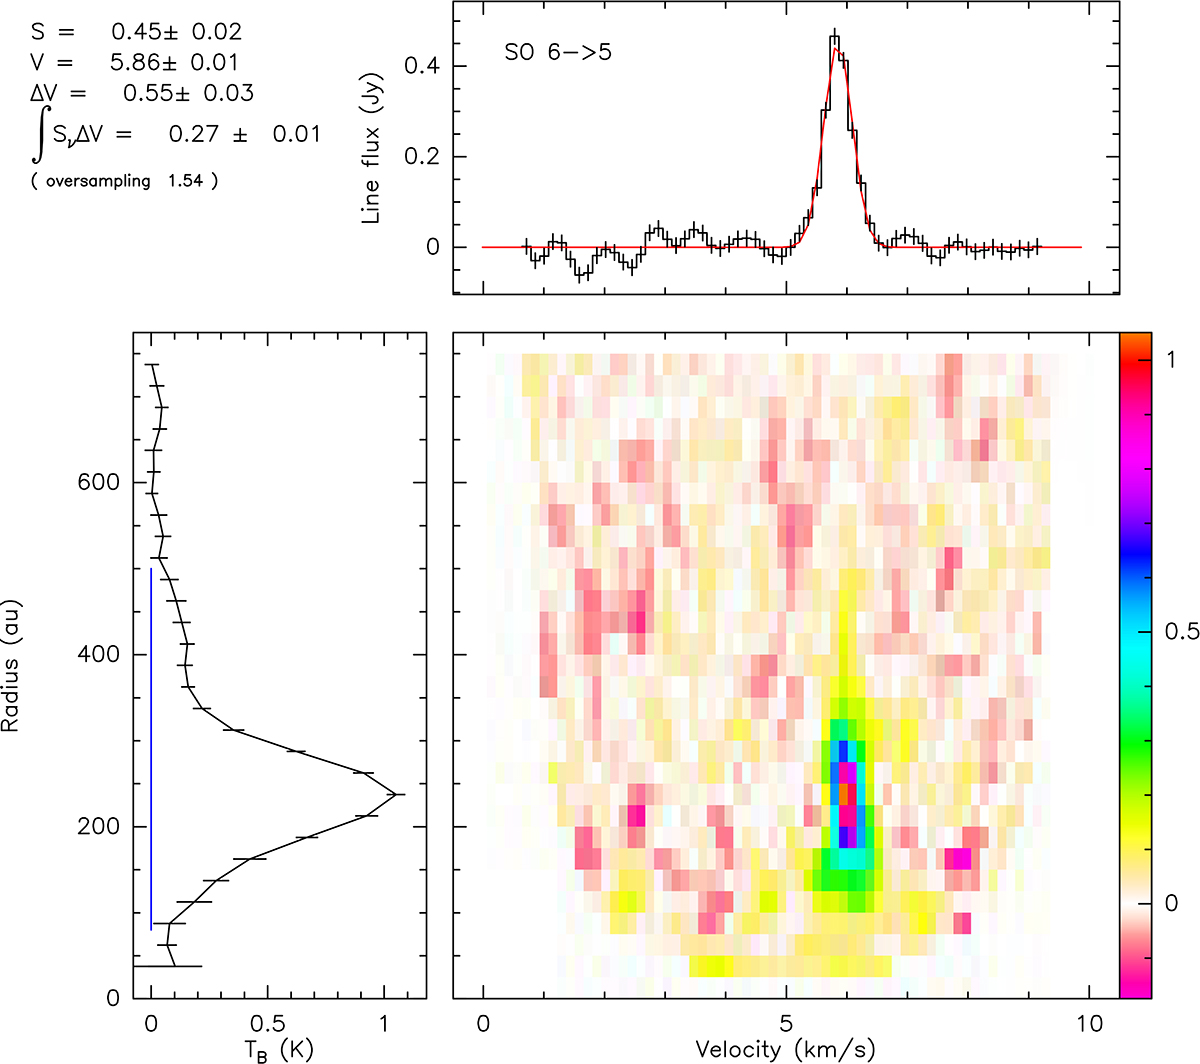
Fig. B.3.
Download original image
Azimuthal average of line profiles obtained after correction from Keplerian rotation for the SO 6-5 transitions. The SO 6-5 data was obtained by stacking the emission from the SO 65-54 and SO 67-56 lines that have similar intensities and excitation conditions. Results of a Gaussian line fit are indicated in the upper-left corner.
Current usage metrics show cumulative count of Article Views (full-text article views including HTML views, PDF and ePub downloads, according to the available data) and Abstracts Views on Vision4Press platform.
Data correspond to usage on the plateform after 2015. The current usage metrics is available 48-96 hours after online publication and is updated daily on week days.
Initial download of the metrics may take a while.