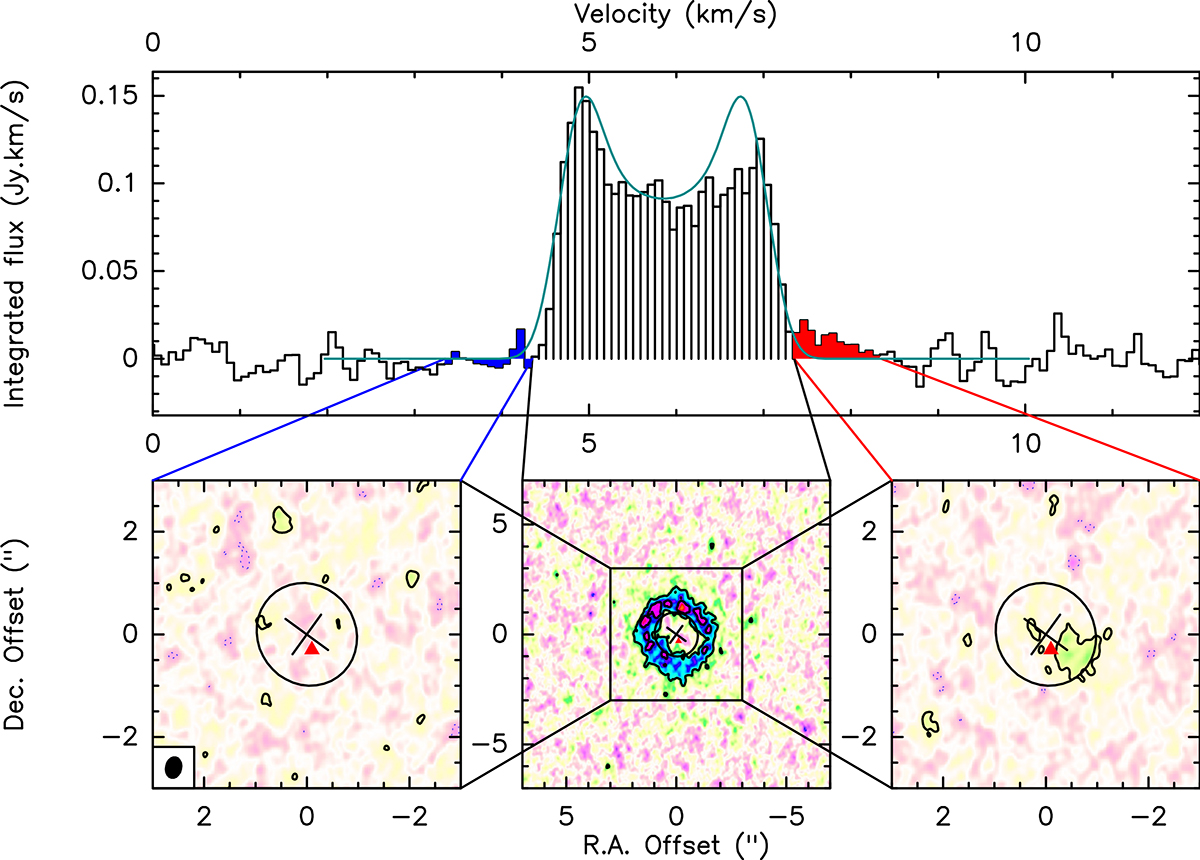
Fig. A.2.
Download original image
SO 56 − 45 emission towards AB Aur. Top: Integrated spectrum (histogram), with best fit rotationally symmetric Keplerian disk model superimposed (greenish curve). Bottom: Integrated emission over the indicated velocity ranges, from blueshifted to redshifted (from left to right). Contour levels are 2.5 σ and 5 σ. The beam size is displayed in the left panel. The cross indicates the AB Aur star position and the disk orientation (PA 126°) and inclination (22°) and the ellipse marks the approximate peak radius of the dust ring. The red triangle is the approximate position of the putative protoplanet traced by CO and near-IR emission.
Current usage metrics show cumulative count of Article Views (full-text article views including HTML views, PDF and ePub downloads, according to the available data) and Abstracts Views on Vision4Press platform.
Data correspond to usage on the plateform after 2015. The current usage metrics is available 48-96 hours after online publication and is updated daily on week days.
Initial download of the metrics may take a while.