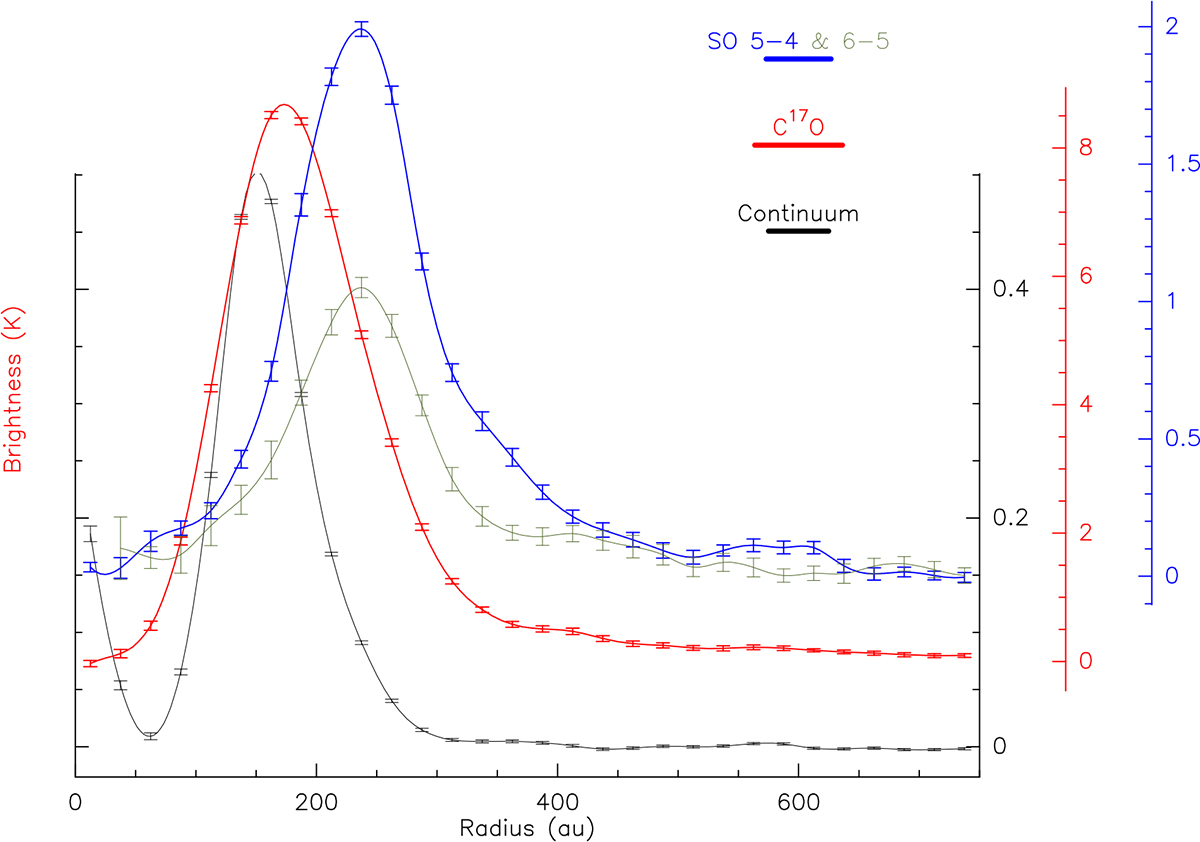
Fig. 2.
Download original image
Azimuthally averaged radial profiles of SO 56–45 and average of the 65-54 and 67–56 lines, the C17O J = 2–1 line, and the continuum emission at 1.3 mm. The error bars indicate the linear resolution for each data set. The respective temperature scales are given on the right axes. The molecular radial profiles are derived from the Keplerian correction (see Appendix A).
Current usage metrics show cumulative count of Article Views (full-text article views including HTML views, PDF and ePub downloads, according to the available data) and Abstracts Views on Vision4Press platform.
Data correspond to usage on the plateform after 2015. The current usage metrics is available 48-96 hours after online publication and is updated daily on week days.
Initial download of the metrics may take a while.