Fig. 3.
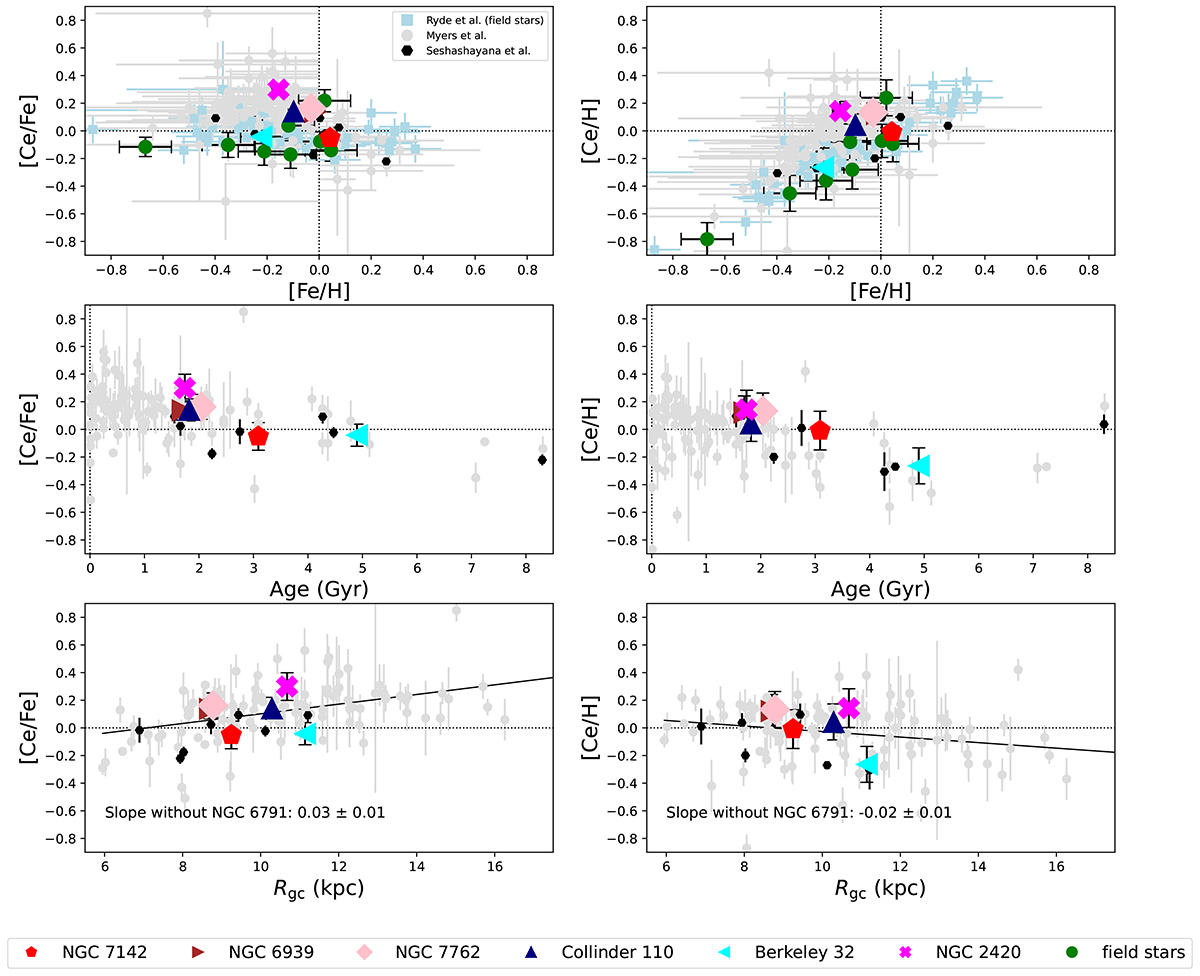
Download original image
Relationship between [Ce/Fe] and [Fe/H], age, and Rgc (left) and [Ce/H] as a function of [Fe/H], age, and Rgc (right). The black hexagons are the OCs studied in our previous paper, Seshashayana et al. (2024). Data for field stars taken from Ryde et al. (2020) are shown as light blue dots. The clusters taken from Myers et al. (2022) are shown as light gray squares. The slopes were obtained via a fit to all strictly similarly analyzed OCs from this and our previous work, excluding the outlier NGC 6791 (see Seshashayana et al. 2024, for a discussion).
Current usage metrics show cumulative count of Article Views (full-text article views including HTML views, PDF and ePub downloads, according to the available data) and Abstracts Views on Vision4Press platform.
Data correspond to usage on the plateform after 2015. The current usage metrics is available 48-96 hours after online publication and is updated daily on week days.
Initial download of the metrics may take a while.