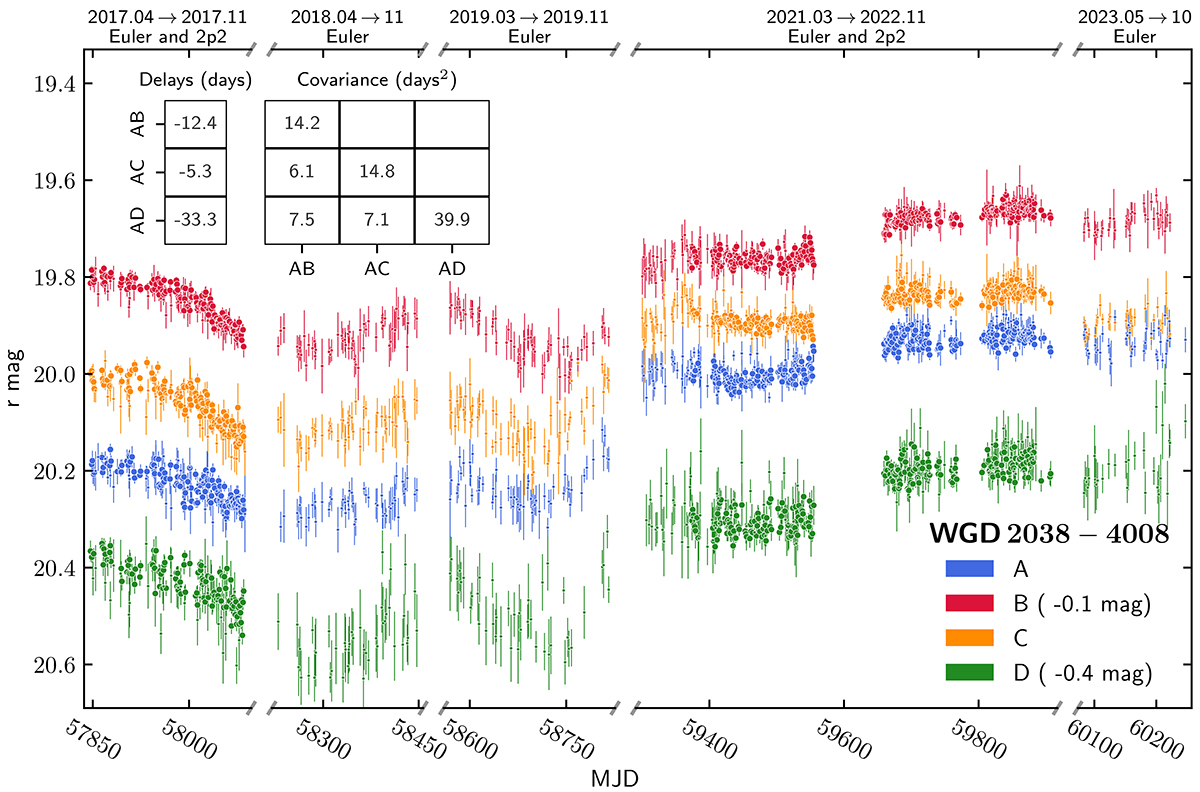
Fig. 2.
Download original image
r-band light curves of WGD 2038−4008, containing 3671 epochs of monitoring data. Data from the 2p2 and Euler telescopes are denoted by full disks and dots, respectively. When double coverage occurred, only the 2p2 data were used in the time-delay estimation. The median delays relative to image A, along with the corresponding covariance matrix, are shown in the upper left corner.
Current usage metrics show cumulative count of Article Views (full-text article views including HTML views, PDF and ePub downloads, according to the available data) and Abstracts Views on Vision4Press platform.
Data correspond to usage on the plateform after 2015. The current usage metrics is available 48-96 hours after online publication and is updated daily on week days.
Initial download of the metrics may take a while.