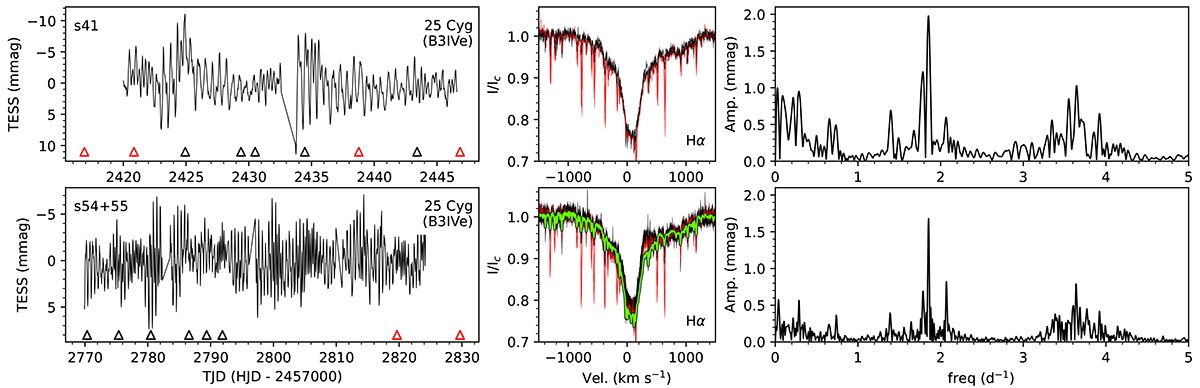
Fig. D.2.
Download original image
Similar to Fig. D.1, but comparing two epochs for the same Be star (25 Cyg). The black (respectively red) triangles in the left panels indicate spectra from NRES (respectively DAO). The same colours are used in the middle panels for data from the two telescopes. The green line in the bottom-middle panel is the average of the NRES Hα profile taken during Sector 41 (i.e. during an emission-free phase).
Current usage metrics show cumulative count of Article Views (full-text article views including HTML views, PDF and ePub downloads, according to the available data) and Abstracts Views on Vision4Press platform.
Data correspond to usage on the plateform after 2015. The current usage metrics is available 48-96 hours after online publication and is updated daily on week days.
Initial download of the metrics may take a while.