Fig. D.1.
Download original image
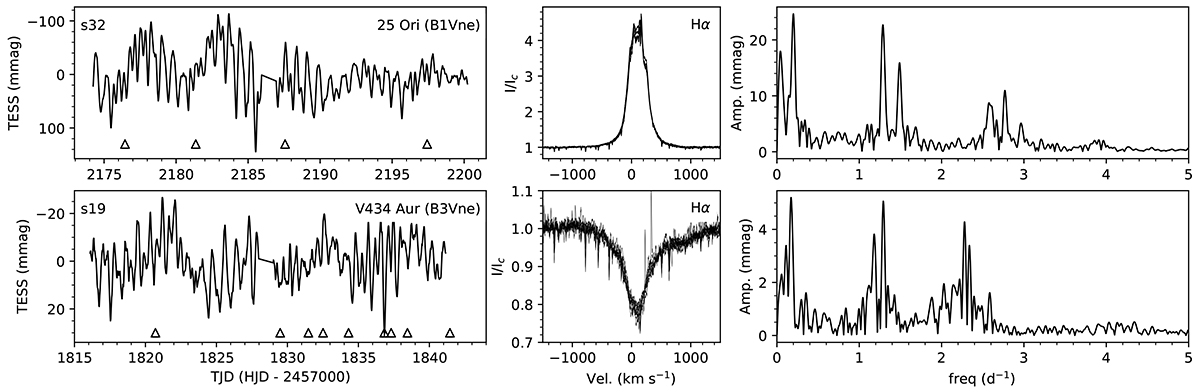
TESS photometry and contemporaneous spectroscopy for two Be stars, 25 Ori (top) and V434 Aur (bottom). The left panels show the TESS light curve from the indicated sector (at the top left), with triangles corresponding to dates of NRES spectroscopic observations. The middle panels show the spectral region centred on Hα for each spectroscopic epoch shown in the left panels. The right panels contain the frequency spectra built from the TESS photometry.
Current usage metrics show cumulative count of Article Views (full-text article views including HTML views, PDF and ePub downloads, according to the available data) and Abstracts Views on Vision4Press platform.
Data correspond to usage on the plateform after 2015. The current usage metrics is available 48-96 hours after online publication and is updated daily on week days.
Initial download of the metrics may take a while.