Fig. 7.
Download original image
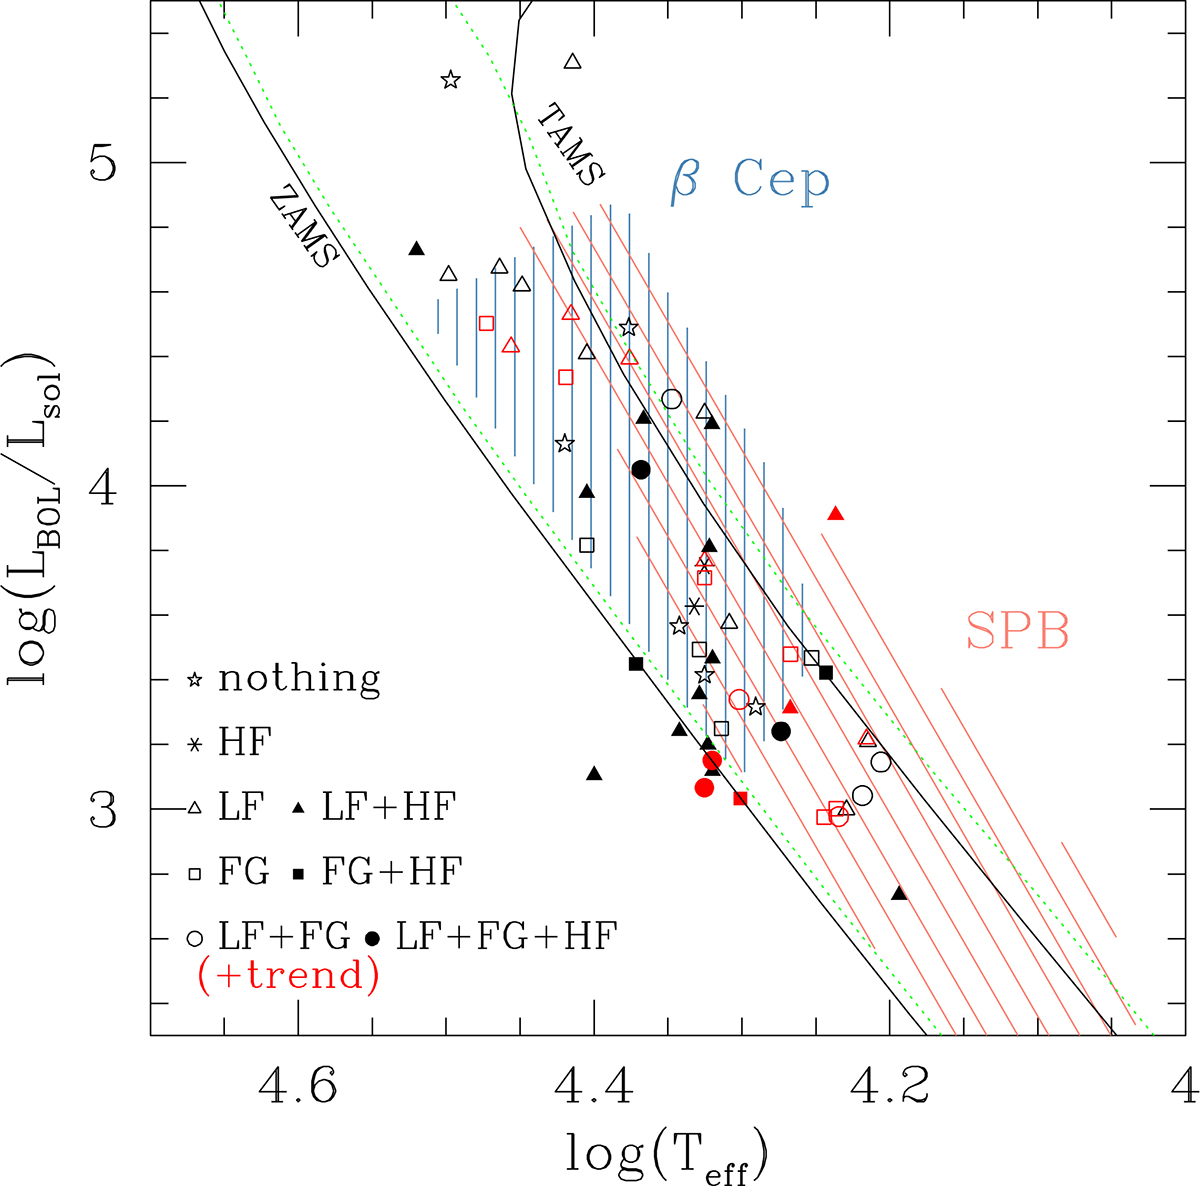
Hertzsprung-Russell diagram. The symbols depict the type of variability and have the same meanings as in Fig. 3. The solid black and dotted green lines are the ZAMS and TAMS from Geneva stellar evolution models for solar abundance without and with rotation, respectively (Ekström et al. 2012; see our Fig. 4). The hatched areas mark the instability zones of β Cep and SPB stars from Miglio et al. (2007).
Current usage metrics show cumulative count of Article Views (full-text article views including HTML views, PDF and ePub downloads, according to the available data) and Abstracts Views on Vision4Press platform.
Data correspond to usage on the plateform after 2015. The current usage metrics is available 48-96 hours after online publication and is updated daily on week days.
Initial download of the metrics may take a while.