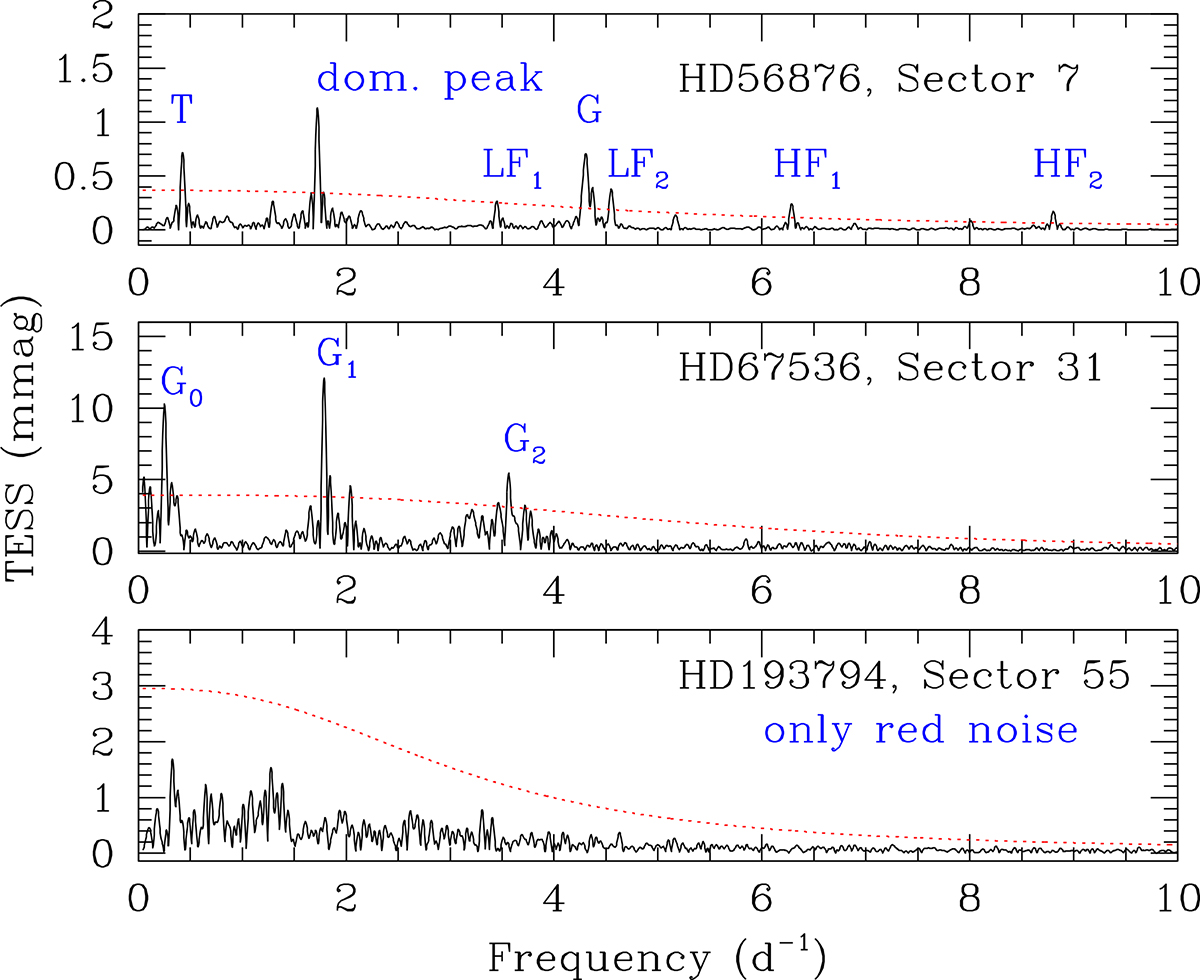
Fig. 5.
Download original image
Three examples of frequency spectra. HD 56876 displays red noise, long-term variations (peak labelled ‘T’ at f < 0.5 d−1), isolated signals at low and high frequencies (labelled ‘dom. peak’, LFi, HFi), and a small FG (labelled ‘G’). HD 67536 displays FGs (labelled Gi) while HD 193794 only displays red noise. The dashed curves correspond to the significance level, set to five times the noise level. Figures showing the full set of frequency spectra are available on Zenodo (https://zenodo.org/doi/10.5281/zenodo.12699682).
Current usage metrics show cumulative count of Article Views (full-text article views including HTML views, PDF and ePub downloads, according to the available data) and Abstracts Views on Vision4Press platform.
Data correspond to usage on the plateform after 2015. The current usage metrics is available 48-96 hours after online publication and is updated daily on week days.
Initial download of the metrics may take a while.