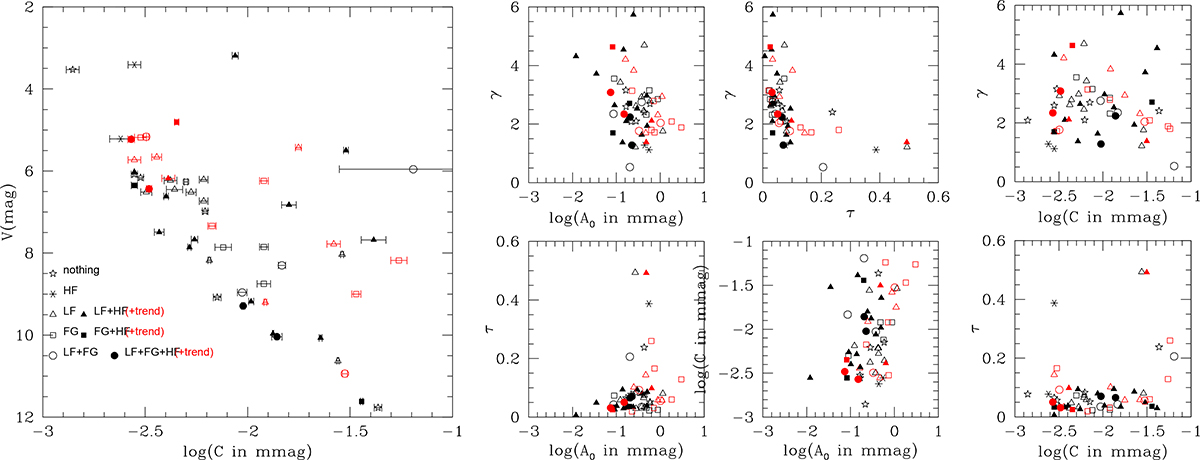
Fig. 3.
Download original image
Comparison between red noise parameters. Left: Comparison between the white noise level, C, and the V magnitude of all targets. Symbols indicate the type of recorded variability (see Sect. 4): objects without any variability beyond red noise are shown as stars, objects with only high-frequency (HF) signals as asterisks, objects with dominating low-frequency (LF) signals as triangles, objects with strong frequency groups (FG) as squares, and objects with both LF and FG signals as circles. For the last three categories, the symbols are filled if high-frequency signals also exist, and empty otherwise. If trends or very low-frequency signals are detected, the symbols are shown in red. Right: Two-by-two comparison between red noise parameters, using the same symbols.
Current usage metrics show cumulative count of Article Views (full-text article views including HTML views, PDF and ePub downloads, according to the available data) and Abstracts Views on Vision4Press platform.
Data correspond to usage on the plateform after 2015. The current usage metrics is available 48-96 hours after online publication and is updated daily on week days.
Initial download of the metrics may take a while.